Page Tree
Previous Releases
...
| Info | ||||
|---|---|---|---|---|
| ||||
In this page we'll explain how to use Sparkline Sparklines in ProjectsDataGrids. |
A sparkline is a very small line chart, typically drawn without axes or coordinates. It presents the general shape of the variation (typically over time) in some measurement, such as temperature or stock market price, in a simple and highly condensed way.
...
Whereas the typical chart is designed to show as much data as possible, and is set off from the flow of text, sparklines are intended to be succinct, memorable, and located where they are discussed
...
Below you will find the steps that needs to be followed in order to use implement a Sparkline (trend on a grid) in your project.
On Edit > Datasets > DBs you will include the external database using one of the providers available in the list. In this example, we are going to use a SQLite provider, in a database called Nwind.
...
Tables available in database.
On Edit > Dataset > Tables/Queries there is the possibility to create internal Tables and Queries for Internal Usage.
The Tables must be mapped to existing ones from the database, as can be seen in the previous section. The Queries are defined for a specific database and can (or not) contain a predefined SQL Statement.
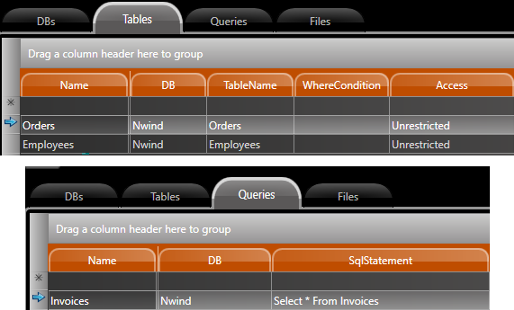
Tables and Query.
After setting up the Tables and Queries that will be used, we must configure one of the Tables as the DataSource of the DataGridWindow component (1).
...