Page Tree
Previous Releases
A sparkline is a very small line chart, typically drawn without axes or coordinates. It presents the general shape of the variation (typically over time) in some measurement, such as temperature or stock market price, in a simple and highly condensed way.
Sparklines are small enough to be embedded in text, or several sparklines may be grouped together as elements of a small multiple.
Whereas the typical chart is designed to show as much data as possible, and is set off from the flow of text, sparklines are intended to be succinct, memorable, and located where they are discussed
Below you will find the steps that needs to be followed in order to use implement a Sparkline (trend on a grid) in your project.
On Edit > Datasets > DBs you will include the external database using one of the providers available in the list. In this example, we are going to use a SQLite provider, in a database called Nwind.
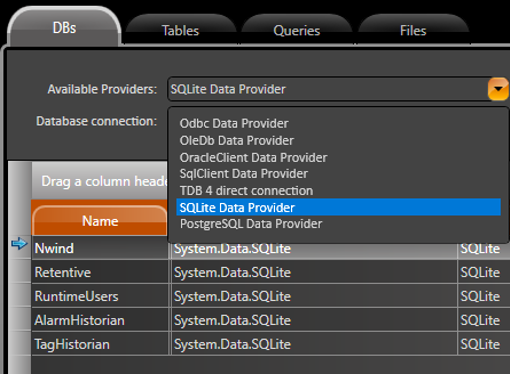
Database configuration.
This Example Database contains many tables in it. However, not all of them will be used on the project. The image below show all Tables and Highlights the ones that will be used.
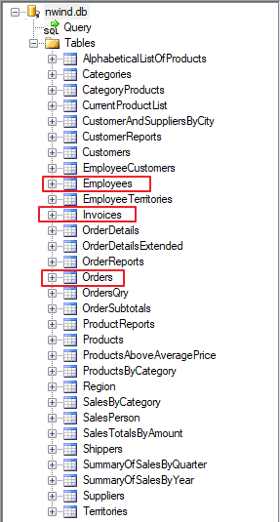
Tables available in database.
On Edit > Dataset > Tables/Queries there is the possibility to create internal Tables and Queries for Internal Usage.
The Tables must be mapped to existing ones from the database, as can be seen in the previous section. The Queries are defined for a specific database and can (or not) contain a predefined SQL Statement.
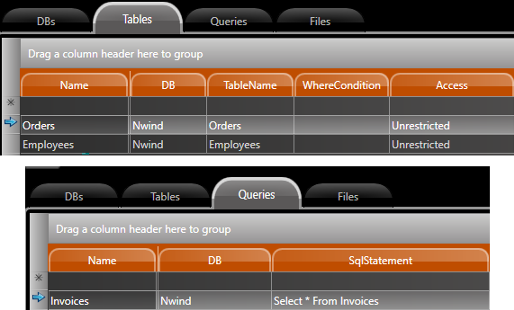
Tables and Query.
After setting up the Tables and Queries that will be used, we must configure one of the Tables as the DataSource of the DataGridWindow component (1).
To manipulate a DataGrid Control in CodeBehind the best approach is by using the Control Name field (2), at the configuration dialog.
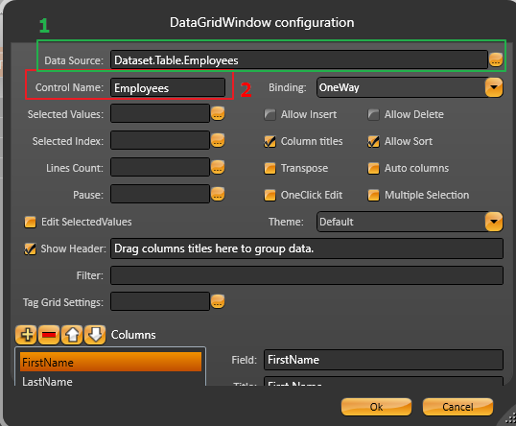
DataGrid Window configuration.
Then, you can use that given name to get control of the element and change its properties.
TDataGridWindow grid = CurrentDisplay.GetDataGrid("Employees");
grid.GridControl.SetColumnSparkline("Orders", this.SparklineCollectionDelegate, style);
// SetColumnSparkline parameters - fieldName (string)
//	               - populateCallback (SparklineCollectionDelegate)
//	               - style (string)
A delegate is an object which refers to a method or you can say it is a reference type variable that can hold a reference to the methods. It provides a way which tells which method is to be called when an event is triggered.
A delegate will call only a method which agrees with its signature and return type. A method can be a static method associated with a class or can be an instance method associated with an object, it doesn’t matter.
Dictionary<int, ArgumentValue[]> mapEmployeeToOrders = null;
private ArgumentValue[] SparklineCollectionDelegate(string fieldName, System.Data.DataRow row)
{
ArgumentValue[] sourceCollection;
int  emplID  =  TK.To< int>(row["EmployeeID"]);
if (!this.mapEmployeeToOrders.TryGetValue(emplID, out sourceCollection))
       sourceCollection = new ArgumentValue[0];
return sourceCollection;
}
The Sparkline is updated following the logic as seen in the sample code below:
// 	Get data from tables 	// DataTable employees =  @Dataset.Table.Employees.SelectCommand();
DataTable orders = @Dataset t.Table.Orders.SelectCommand();
DataTable invoices = @Dataset.Query.Invoices.SelectCommand();
// 	//

this.SetSparkline(style); // Set Style to Sparkline this.mapEmployeeToOrders = new Dictionary<int, ArgumentValue[]>();
foreach (DataRow empl in employees.Rows)
{
int  emplID  =  TK.To<int>(empl["EmployeeID"]);
ist<ArgumentValue> sourceCollection = new List<ArgumentValue>();
foreach (DataRow order in orders.Select("EmployeeID = " + emplID))
{
int  orderID  =  TK.To< int>(order["OrderID"]); ArgumentValue av = new ArgumentValue();
av.Argument  =  order["OrderDate"];  //  x-axis  for  sparkline
foreach (DataRow invoice in invoices.Select("OrderID = " + orderID))
{
double value = TK.To< double >(av.Value);
double  quantity  =  TK.To< double >(invoice["Quantity"]);
double  unitPrice  =  TK.To< double >(invoice["UnitPrice"]);
av.Value = value + (quantity * unitPrice); // y-axis for sparkline
}
sourceCollection.Add(av);
}
//  map  values  (y-axis)  and  order  date  (x-axis)  to  employee  ID this.mapEmployeeToOrders[emplID] = sourceCollection.ToArray();
}
The Styles available for Sparkline are:
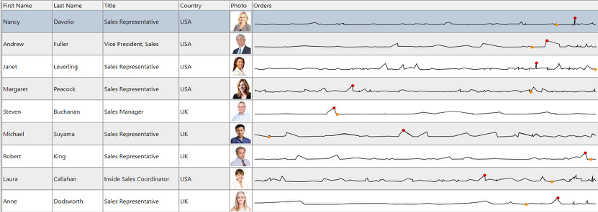
DataGrid Window configuration.
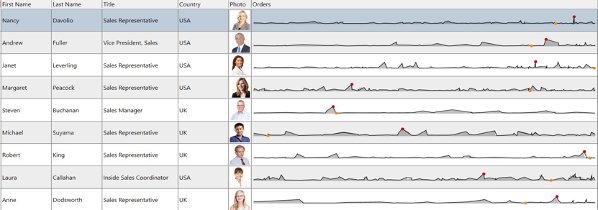
DataGrid Window configuration.
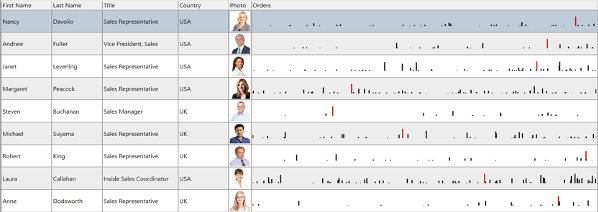
DataGrid Window configuration.
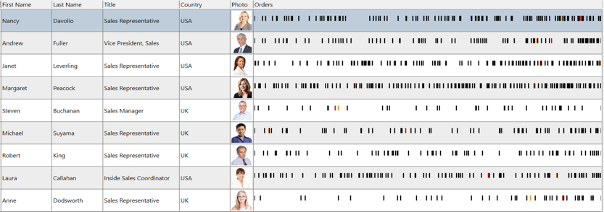
DataGrid Window configuration.
Values are represented by bars that either grow up or go down from an invisible line