Page Tree
Previous Releases
Reports can have multiple graphical components: tags, symbols, tables, and trends. All these components have the capability to update data once a report is generated; providing users with the most recent data in their reports. Reports can be saved into files, like XPS, HTML, Unicode, ASCII, or PDF.
To create or edit a report:
Name: Enter a name for the report. The system will let you know if the name is not valid.
Padding: Use padding when replacing a tag name with its value (the field starts with enough space for the same number of characters as the tag name):
SaveFormat: Selects the report format:
SaveFileName: Enter a string with {ObjectProperties}. Use the full path
SaveTrigger: Enter an object property as the trigger
Append: Enter the file that appends the report
Size: The size of the report
EditSecurity: Check which user groups can edit the report
Header: Choose another report as the Header
Footer: Choose another report as the Footer
Legacy: Read-only. Shows if the report is a legacy
Description: Enter a description of the report
The Text Editor is used to create the text, formatting, and values for a report.
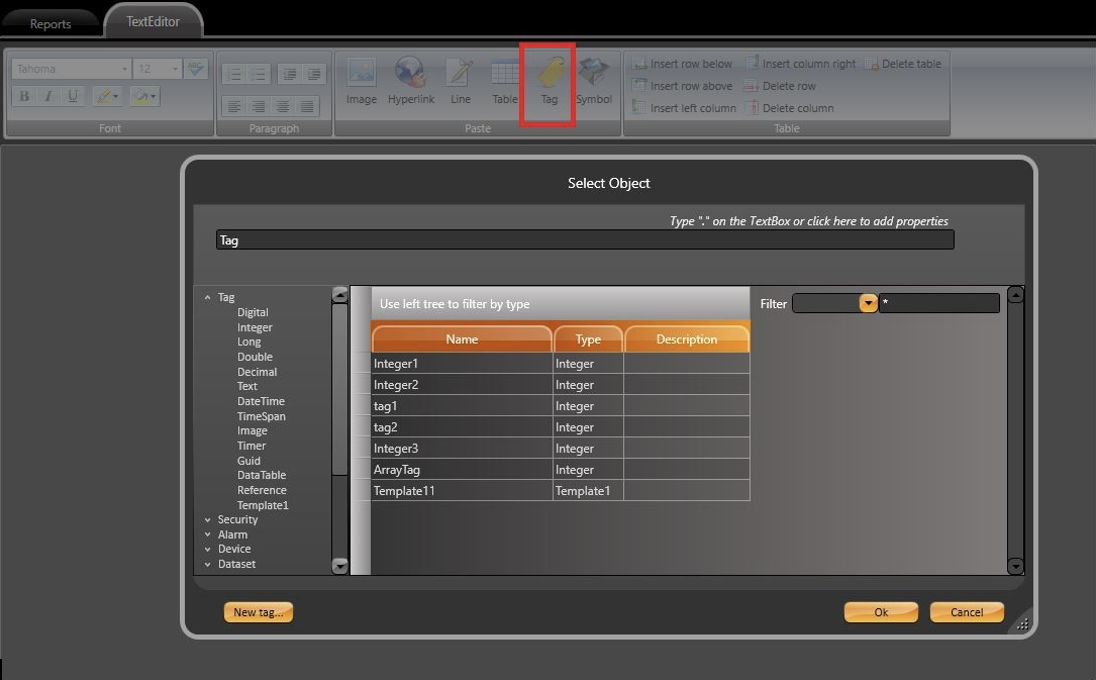
To add a tag to a report, the tag's name must be written between curly brackets so the system understands it as a tag and not as a string.
{Tag.<TagName>}
An easier way to add a tag to a report is by searching through all project elements. To do so, click on the Tag button on header bar. It will place the tag with the correct formatting.
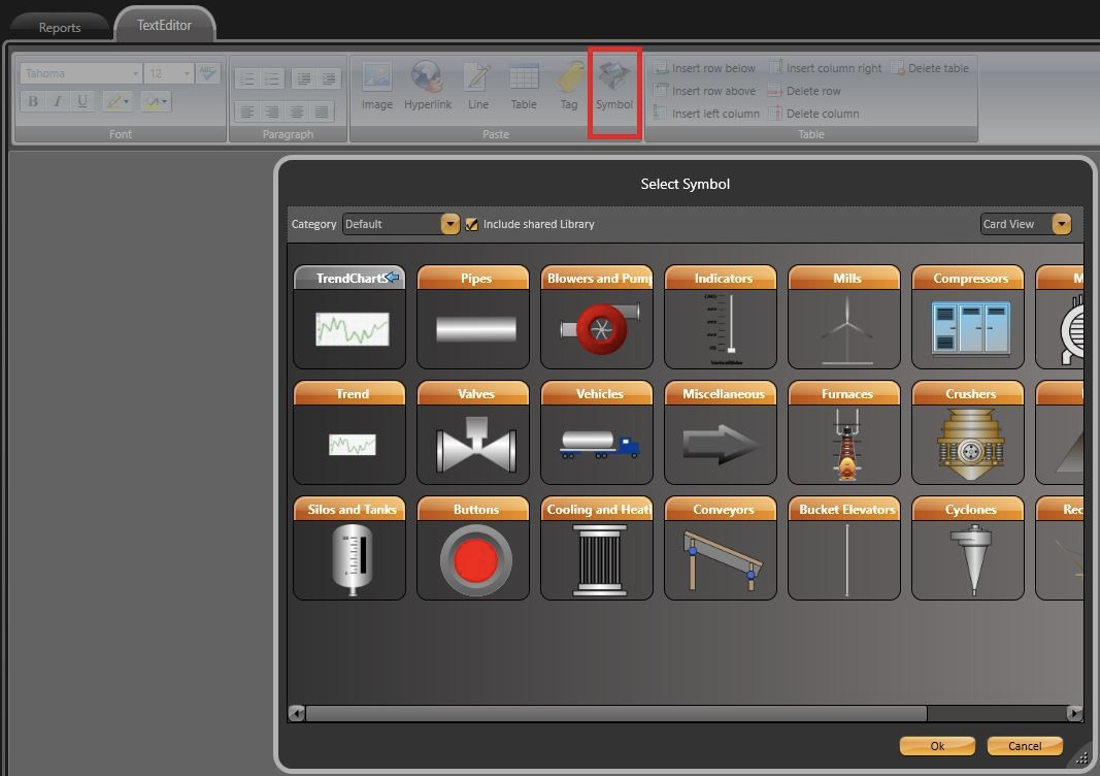
Symbols can be added in a similar way. Simply, click on the Symbol element and choose the desired Symbol. It is worth mentioning that the Symbol will have the appearance it had when the report was exported.
You can use the method above to add Trend Elements to a Report. (More details will be in following sections.) However, this is not possible for Alarm and Grid Objects.
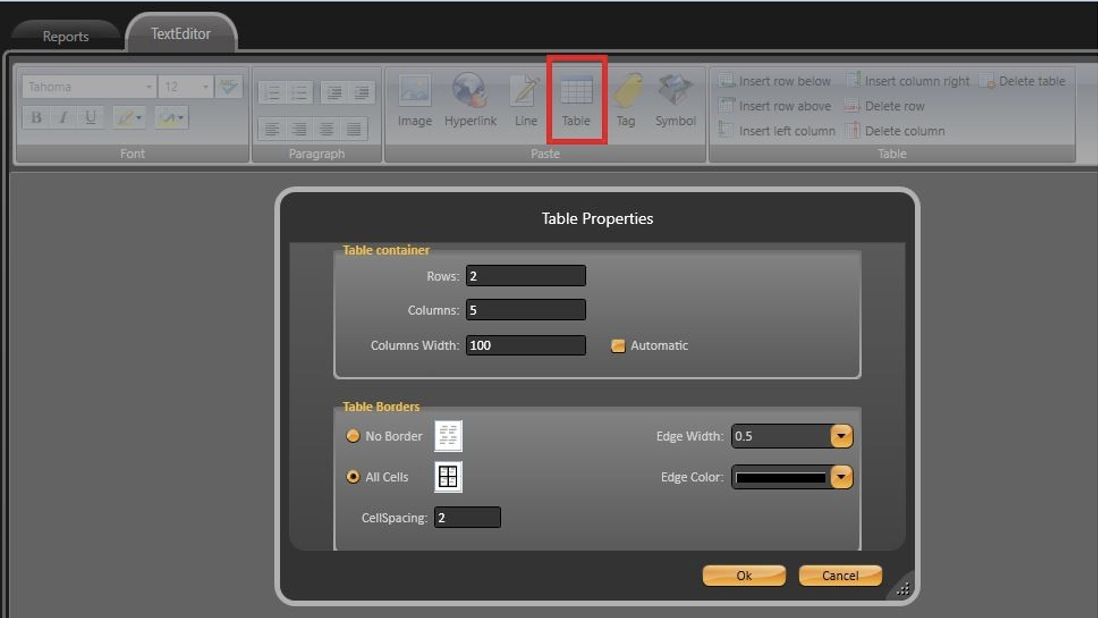
For these objects, there is a Table functionality that is accessed through the Header Bar.
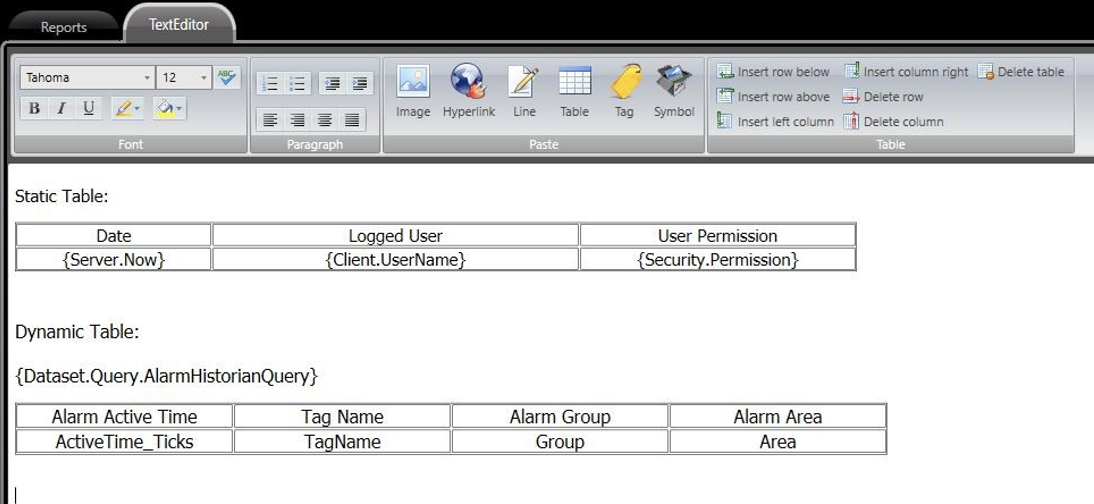
For static tables, you must specify the number of rows and columns, and you need to populate its cells with the desired information.
For dynamic tables (populated via queries), you have to insert the query name (or table) that it will fetch data from when the report is saved.
To select and name the desired rows, write the Column Name from the final Report in the first row and the Column Name from the database in the second row.
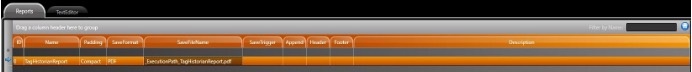
The Namespace Report lists every configured report. The Report is saved with one of the following methods:
@Report.<ReportName>.Save
// Property used to trigger the save report action
@Report.<ReportName>.SaveCommand(int Orientation)
// Orientation = 0 or blank -- Portrait Mode
// Orientation = 1 -- Landscape Mode
// saves the selected report into the path indicated by the SaveFileName
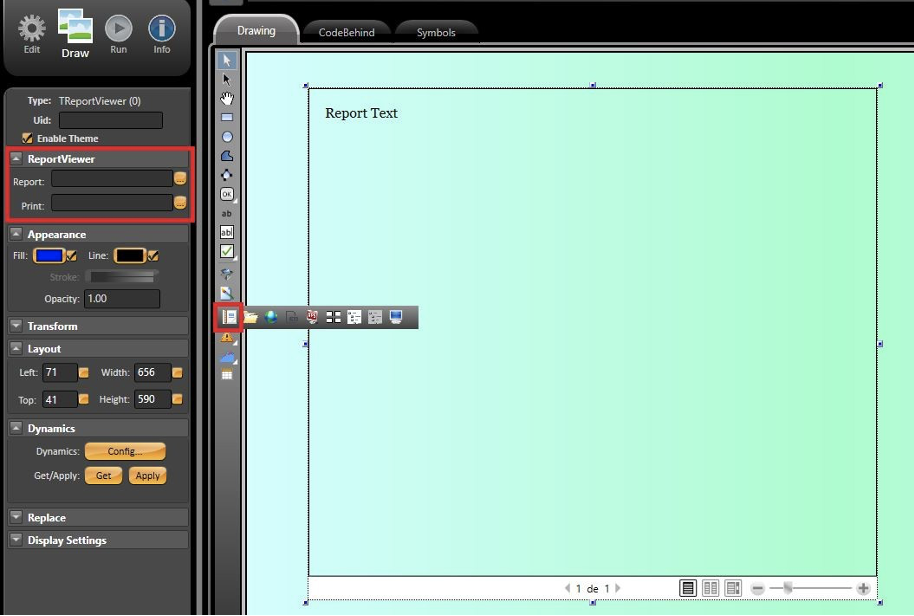
There is a built-in component called the Report Viewer that allows a newly created Report to be displayed in a running project's Display. Report Viewer's two properties are configured in the sidebar.
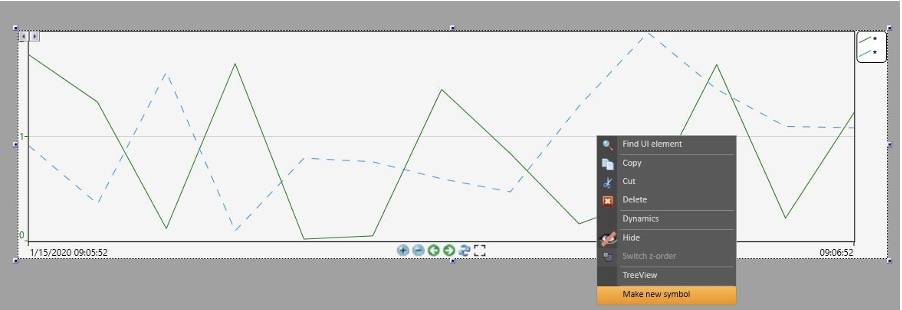
To add a TrendChart Element to a report, you will need to create a new Symbol from the Trend. To do so, right-click the desired element and select ”Make New Symbol ”
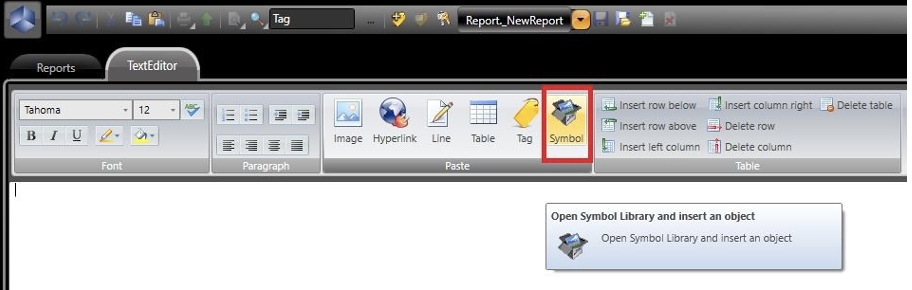
Go to Edit > Reports > TextEditor, and select ”Symbol ” in the header bar. Then, select your Trend Symbol.
Note
If the Trend is modified in your project, the one inside the Report will be updated automatically.
To add a DataGrid to a Report, go to Edit > Reports > TextEditor, and select ”Table” in the header bar. A configuration window will popup. Fill it out with the desired number of columns and only TWO rows.
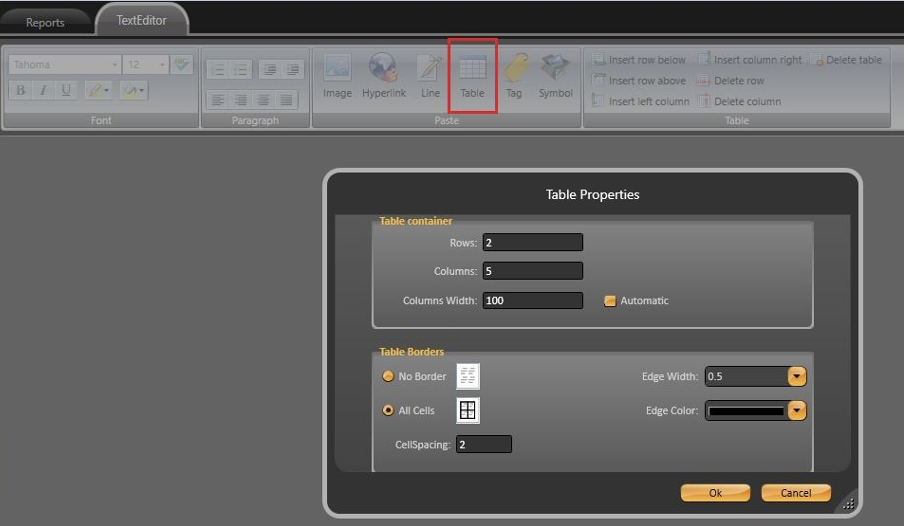
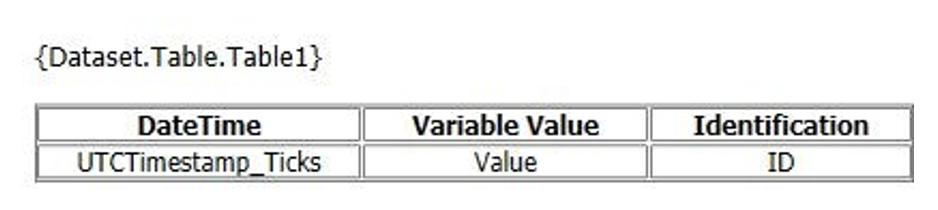
In the first column, write the text that will appear as the Column Name in the printed report. In the second column, write the correct Column Name from the database.
To populate the Datagrid, all you have to do is include the table name, as in the image, in order for it to be done automatically.
The next two features, colored grid and translating grid data in reports, require the addition of a callback function in Script > Classes > ClientMain. This function is called every time the DataGrid object is modified.
The Callback function syntax is as follows:
public void OnReportCustomTableCell(string reportName, string columnName, System.Data.
DataRow row, System.Windows.Documents.TableCell tableCell)
{
// Insert Code Here
}
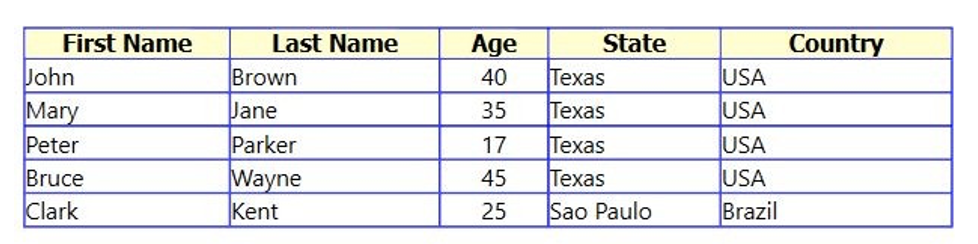
In this example, we will add the following table to our Report:
It is possible to dynamically color the Table Cells using the input parameters of the Callback Function. You can filter by the ColumnName and Rows.
The code below shows an example of how this feature can be implemented.
public void OnReportCustomTableCell(string reportName, string columnName, System.Data.
DataRow row, System.Windows.Documents.TableCell tableCell)
{
if (columnName == "Age")
{
if (TConvert.To<int>(row["Age"]) == 40) tableCell.Background = Brushes.Red;
else if (TConvert.To<int>(row["Age"]) < 30) tableCell.Background = Brushes.Yellow;
else
tableCell.Background = Brushes.Green;
}
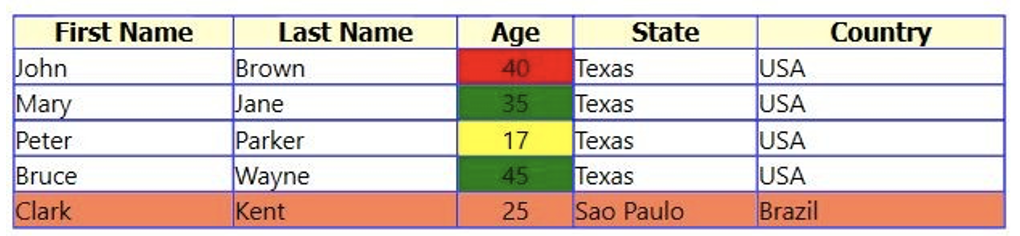
if (row["Country"].ToString() == "Brazil") tableCell.Background = Brushes.Coral;
}
The result achieved by the example code is presented in the image below.
For reports that have different translation options, the first requirement is to create Dictionaries in Run > Dictionaries > Localization.
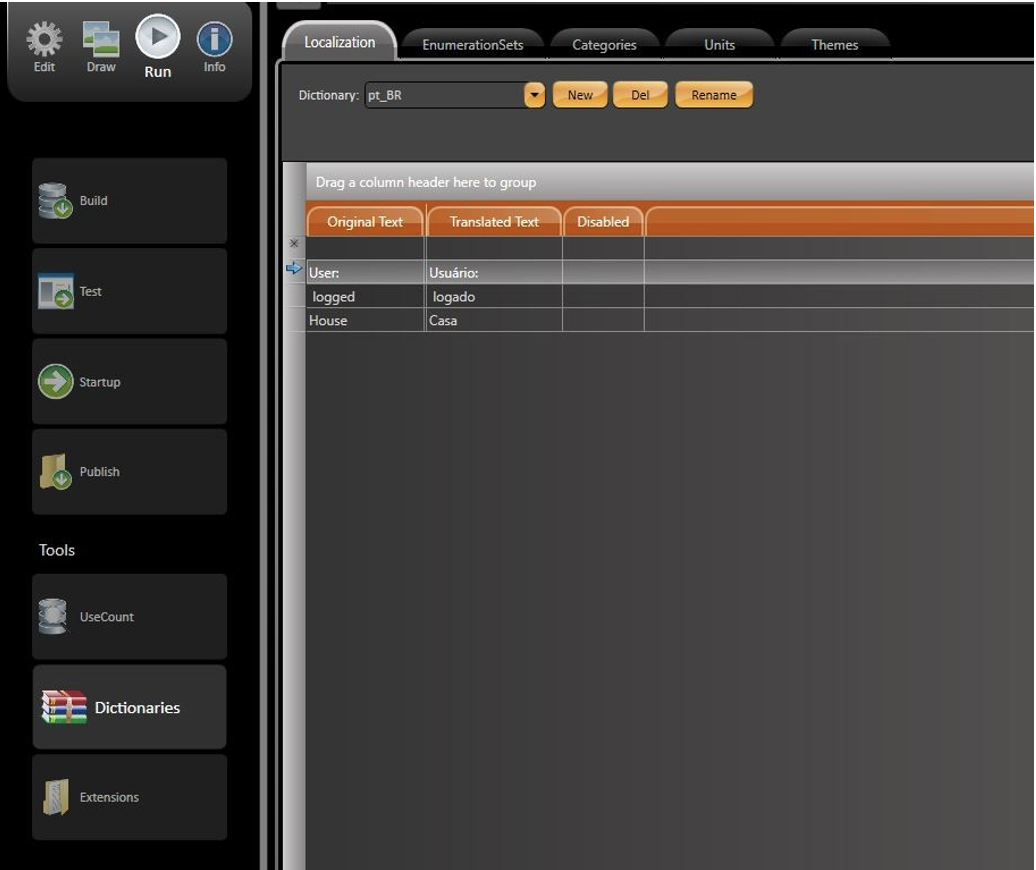
To switch between languages, use the property:
@Client.Localization = "" // for default dictionary
//or
@Client.Localization = "<Dictionary_Name>"
For Tables and Tags, the property above should be enough. However, the callback function must be used to translate an Alarm AuditTrail with added Custom Messages and Comments.
To enable the translation of custom messages, you must add a string element to the itemName input parameter, as seen below:
string itemName = "{object}"
A final AddCustomMessage with localization capabilities should look like this:
@Alarm.AuditTrail.AddCustomMessage("User: {" + @Client.UserName + "} logged", null, null, null, "{object}", null, null);
The code added to the callback function is presented below:
public void OnReportCustomTableCell(string reportName, string columnName, System.Data.DataRow row, System.
Windows.Documents.TableCell tableCell)
{
if  (row["ItemName"].ToString() == "{object}")
{
string[]  Message_Split_Parts  =  row[columnName].ToString().Split(’{’,  ’}’); string Translated_Message = "";

for (int i = 0; i <= Message_Split_Parts.Length - 1; i++) {

// Translate the custom message part
Translated_Message += @Client.Locale(Message_Split_Parts[i]);

Run  cellText  =  (tableCell.Blocks.FirstBlock  as  Paragraph).Inlines.FirstInline  as  Run;

// Replace the original message with the translated one. cellText.Text = Translated_Message;
}

}
}
The Datagrid is added to the Report following the default logic for tables. The Datagrid language will depend on the dictionary that was enabled when the report was saved.
To add a Header and/or Footer to a Report, you need to create one independent report for each. Then, set the reports as the Header and Footer in the Main Report. See image below.
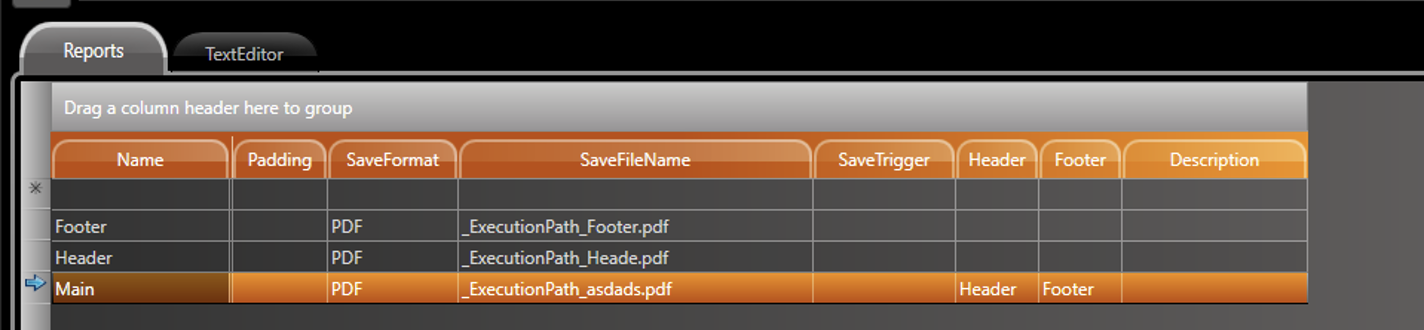
The Header and Footer data (can be text, image, or page numbering) will be replicated throughout the Main document.
To dynamically number the pages of a Report, you will need to write the macro #PAGE wherever you want the page number to be placed. You can also use the macro #TOTALPAGE to get the total page number.
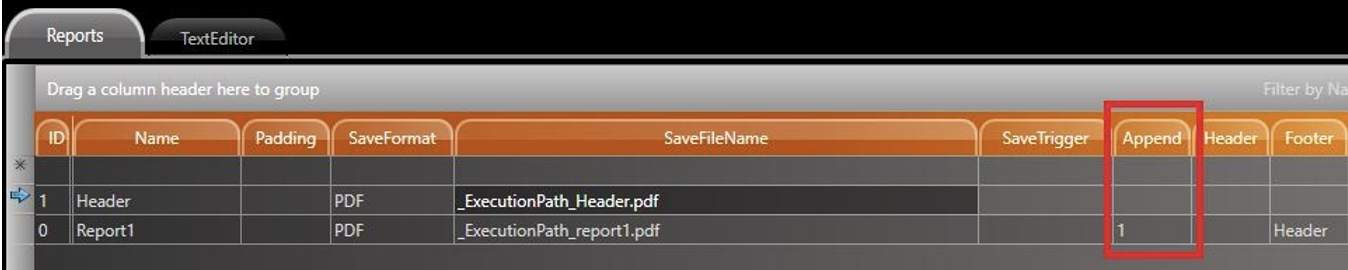
By default, when a new report is generated, it replaces the old one if the SaveFile path and ReportName are the same.
However, it is possible to append the most recent data into an existing report, which allows the old and new data to be displayed in the same ReportFile.
To do so, you need to enable the ”Append” column in Devices > Reports > Reports, and insert the number ”1 ” in it.
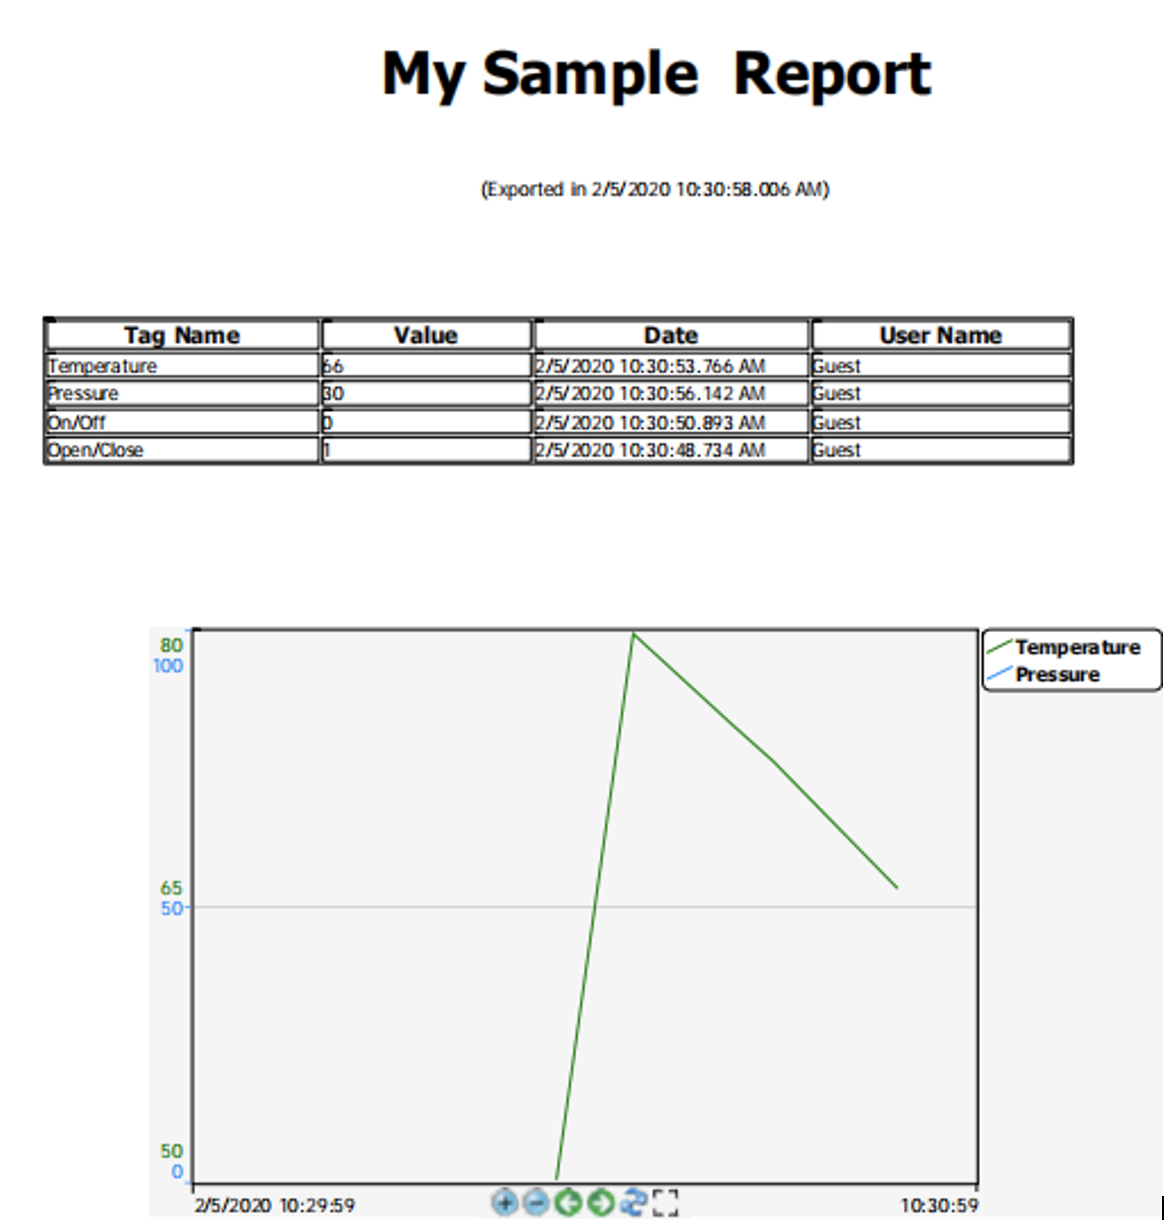
Below is an example of the creation of a report with all of the elements mentions above. It is a sample report with a Trend, Tags, and Tables.
The Table was created in a static format for it to be populated by different Tags (and their current values at the moment the report was saved) as well as the timestamp of their last value.
There is also a Trend element (added as a symbol) that displays the configured Pens (Tag.Temperature and Tag.Pressure) when the Report was saved.
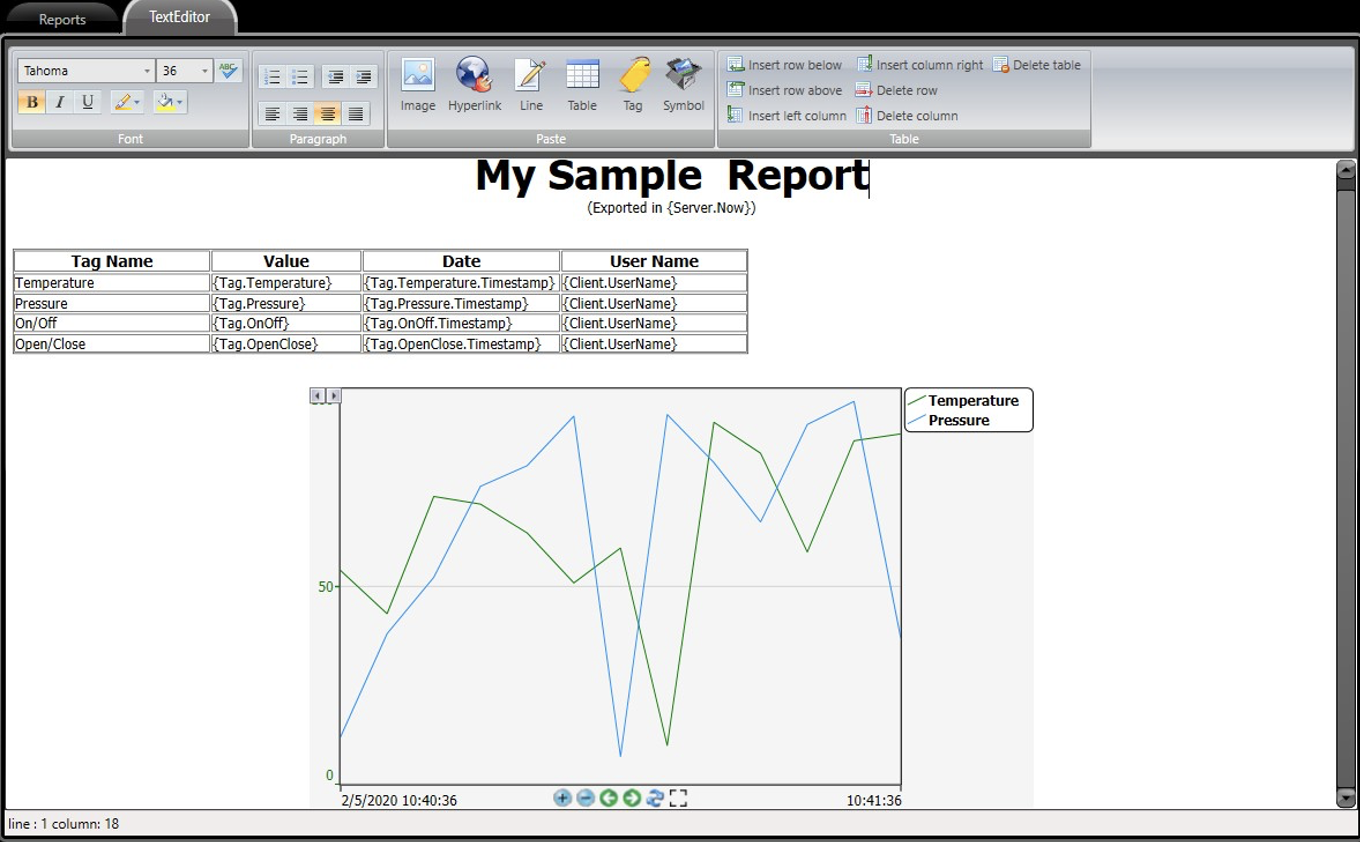
Finally, the created pdf file can be seen below.
Using Report with Header and Footer.
Using Report with Translated DataGrid.
Using Report with Colored DataGrid.