Page Tree
Previous Releases
...
| Info | ||
|---|---|---|
| ||
Quick video tutorial (no audio) |
Table cells can be dynamically colored by using the input parameters of the Callback Function. You can filter tables by ColumnName and Rows.
To use this feature, you will need to add a callback function in in the ClientMain class that is called every time the DataGrid is modified.
...
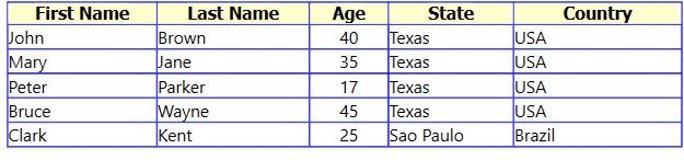
In this example, we will add the following table to our Reportreport:
 It is possible to dynamically color the Table Cells using the input parameters of the
...
The code below shows an example of how this feature can be implemented.
...
The result achieved by the example code is presented in the image below.
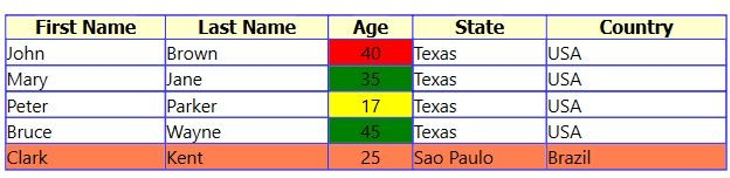 Colored Sample Table.
The new Colored colored DataGrid is added into the Report report following the same logic as before.
You will need to insert Insert a table , with the correct number of columns and only TWO rows. In the first column you will , write the text that will appear as Column Name be the column name in the printed report.
In the second column you will , write the correct Column Name as column name that is in the Databasedatabase.

How to add a Table to a Report.
Since the callback function is placed into the ClientMain Classclass, the Reports reports containing DataGrids will only be colored if the Report report is being saved in by one of the following methods:
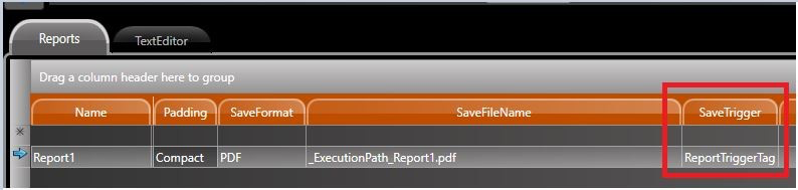 Report save properties.