Page Tree
Previous Releases
...
| Info | ||
|---|---|---|
| ||
This document has information on the Demo Projects developed for FrameWorkX FactoryStudio’s version 9.2 Release. Download here. |
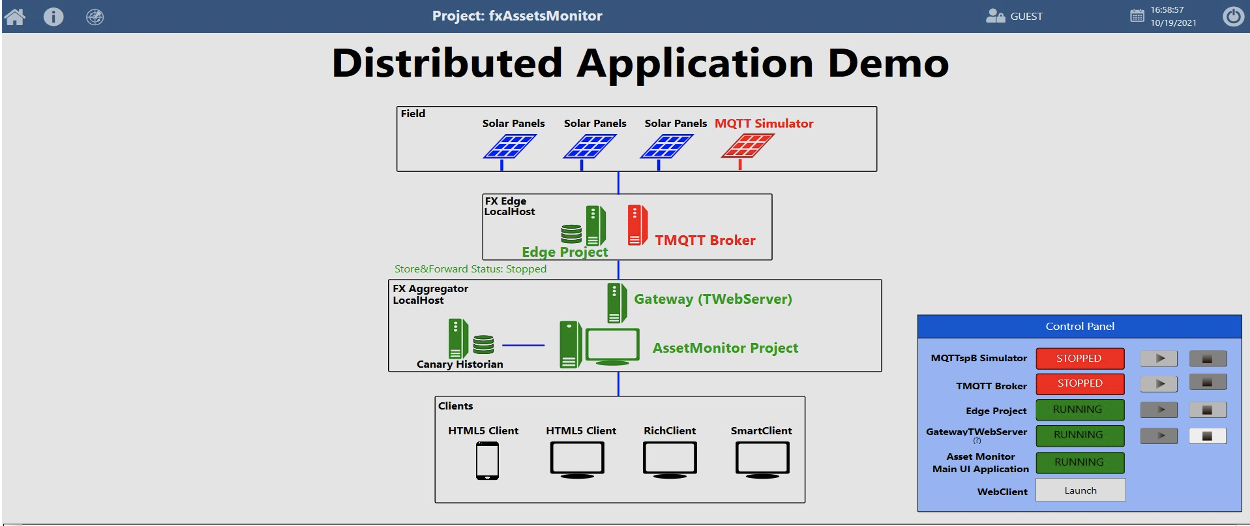
The Demo architecture is illustrated in the image below.
...
The Project FsEdge-MQTTspBCollector, available here, fxEdgeBCollector, will act as a Gateway for the data generated by the an MQTTspB Simulators Simulator to the CanaryHistorian through an MQTTspB Broker.
The configuration is done without any FactoryStudio Tags, using only the TagProvider Unified Namespace (see more information on this topic on its documentation). To make sure you have the correct behavior, make sure the following settings are correct:
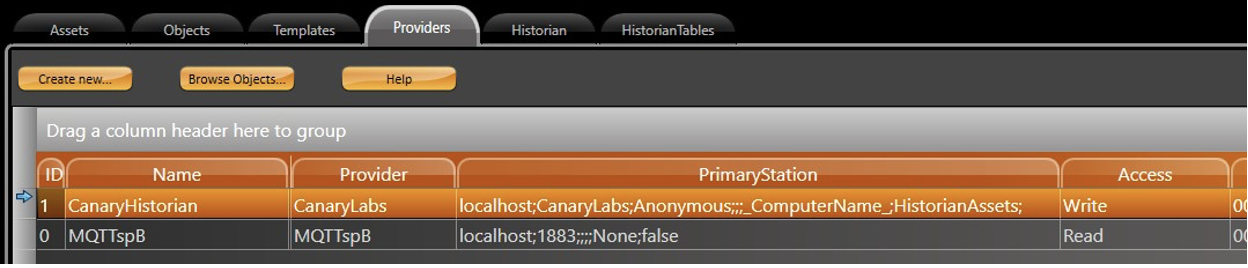
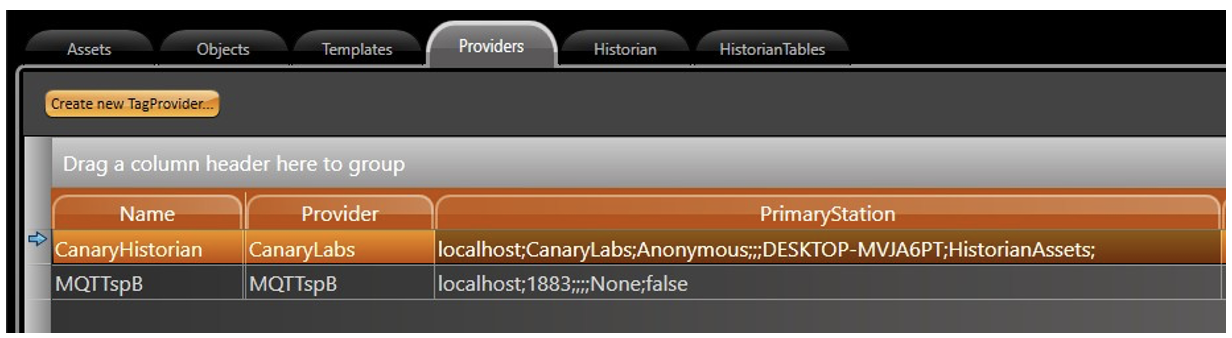
At Edit → Tags Providers → MQTTspB, change the connection parameters according to your Broker. You can use Tatsoft’s default one (TMQTTBroker).
For more information on the MQTTspB Protocol and TMQTTBroker, please refer to their documentation. MQTTspB and TMQTTBroker.
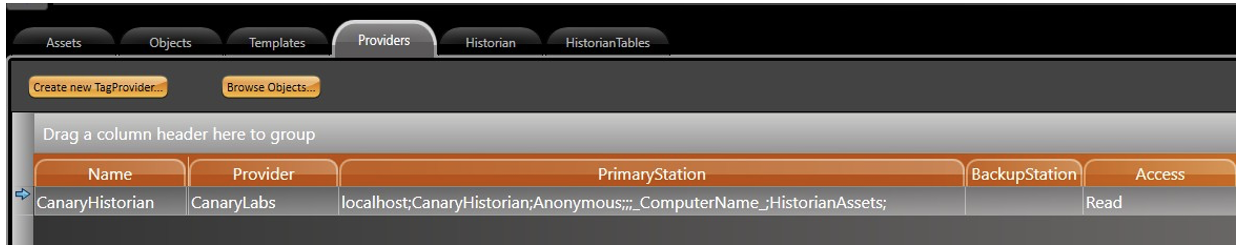
At Edit → Tags Providers → CanaryHistorian, map the Server Name and View to the Historian Server that will be used.
The Dataset mapped don’t need to pre-exist on your Server, as it can be auto-created by this application. For more information on the CanaryHistorian Protocol, please refer to its documentation (CanaryHistorian).
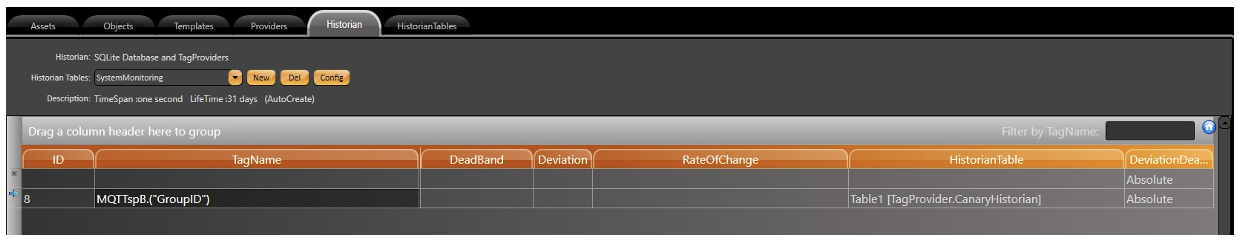
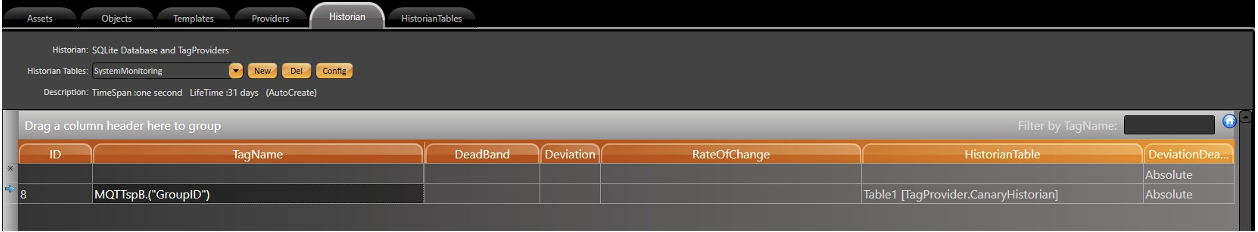
→ Historian, you will see an entry from the MQTTspB Provider, mapping a Dynamic Tag to be historized. By mapping the GroupID with the syntax (”GroupID”) all child elements (NodeIds, DeviceIds and attributes) will be automatically historized as well.
At Edit → Tags → Historian, you will see an entry from the MQTTspB Provider, mapping a Dynamic Tag to be historized. By mapping the GroupID with the syntax MQTTspB.(”GroupID”) all child elements (NodeIds, DeviceIds and attributes) will be automatically historized as well.
| Note |
|---|
There is a setting that determines how quickly the CanaryHistorian service rebuild their views cache when new tags or metadata arrive. That setting is in the CanaryViews.exe.admin file located in the installation location under the Views subfolder. |
The parameter is called lockoutTimeForRecaching and the default is 5 minutes. The Views service only reads this setting when the service is starting. So, any manipulation to the value would require a restart of the Views service. The installation will try to modify this configuration to 0You can launch the Project and keep it running while we setup the MQTTspB Simulators in the next section.
This section details the necessary configuration regarding the MQTTspB Simulator and configuration files. First of all, make Make sure you have access to the Simulator.zip and MQTTspBSimulator.pdf files.
Inside this file, you will find the Simulator configuration file to be used in this Demo.
you have a file called MQTTspBSimulator-Demo9.2.exe.config inside the same directory as the sample projects. This file contains the information required for customizing the simulator to create Tags in a specific format.
| Note | ||
|---|---|---|
| ||
Make sure the config file is placed in the same folder as the Demo Projects (Edge and Visualizer), and DO NOT change the configuration file name. |
The syntax for the configuration file is described below:
...
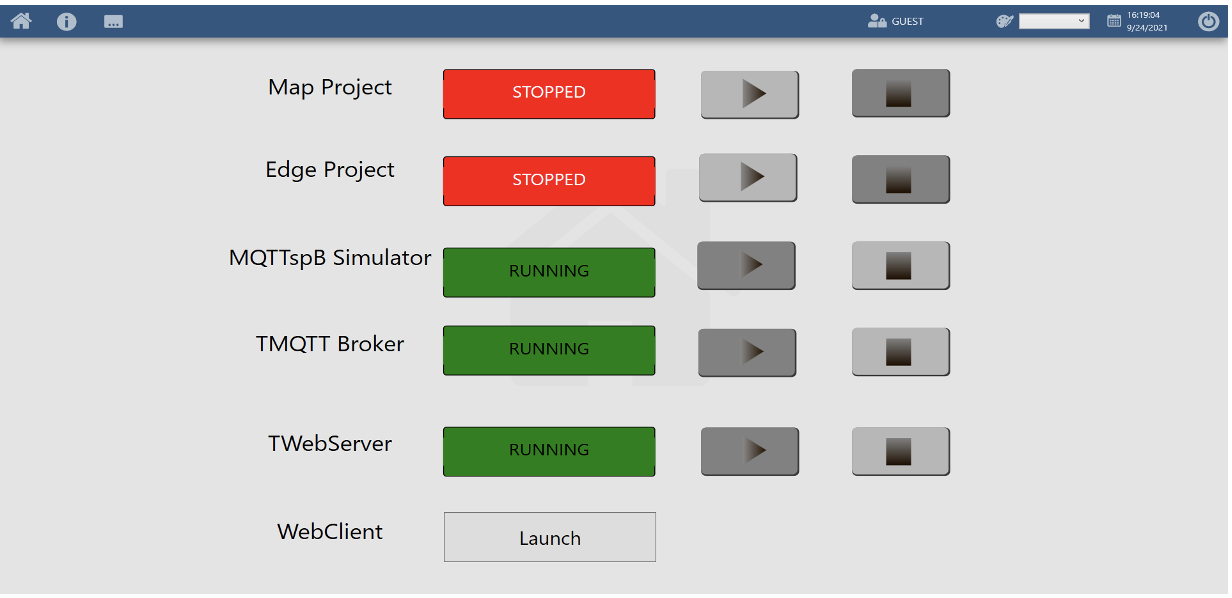
The User Interface and Data Visualization portion of this demo consists in a Project, fxAssetsMonitor, with a .Net Display to administrate the project applications and an a HTML5 Display and WPF Displays for the SolarPanel assets, loaded from CanaryHistorian, in the AssetsControl and Map component.
...
There is also a button to launch the HTML5 WebClient in MsEdge Browser.
...
It is possible to navigate and dynamically create some displays based on the Asset content (amount of Solar Panels and its details).
| Note | ||
|---|---|---|
| ||
Make sure you have a WebServer (TWebServer or IIS) running on this machine. |
Before running the Project, you will have to modify the CanaryHistorian connection string parameters in order to connect to your own Server. To do so, navigate to Edit → Tags → Providers → CanaryHistorian and map the the same Server Name, View and Dataset defined in the fxEdgeCollector Project.
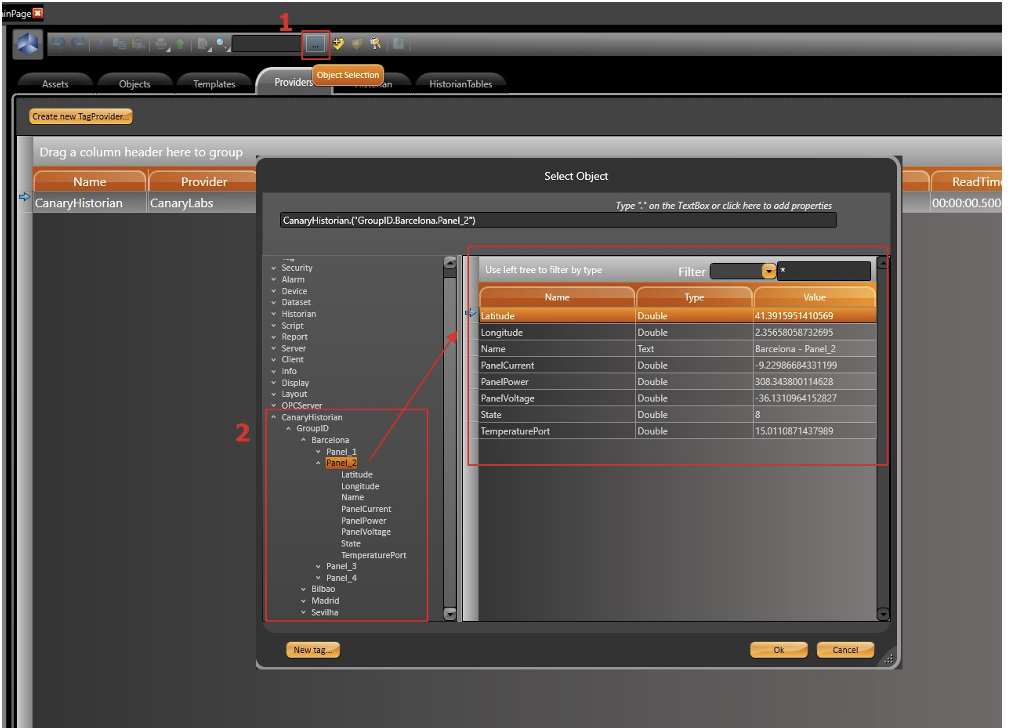
You can check if the TagProvider is correctly configured and able to retrieve data by clicking on the Object Selection Button (1) at the top toolbar. Browse through the CanaryHistorian object to see its children elements (2).
Run the Project and open the WebClient on your browser of choice. The URL syntax for the WebClient is
http://?IpAddress?:?WebServerPort?/fs-9.2/html5/index.html
The URL information is also available in Info → Project → Redundancy.
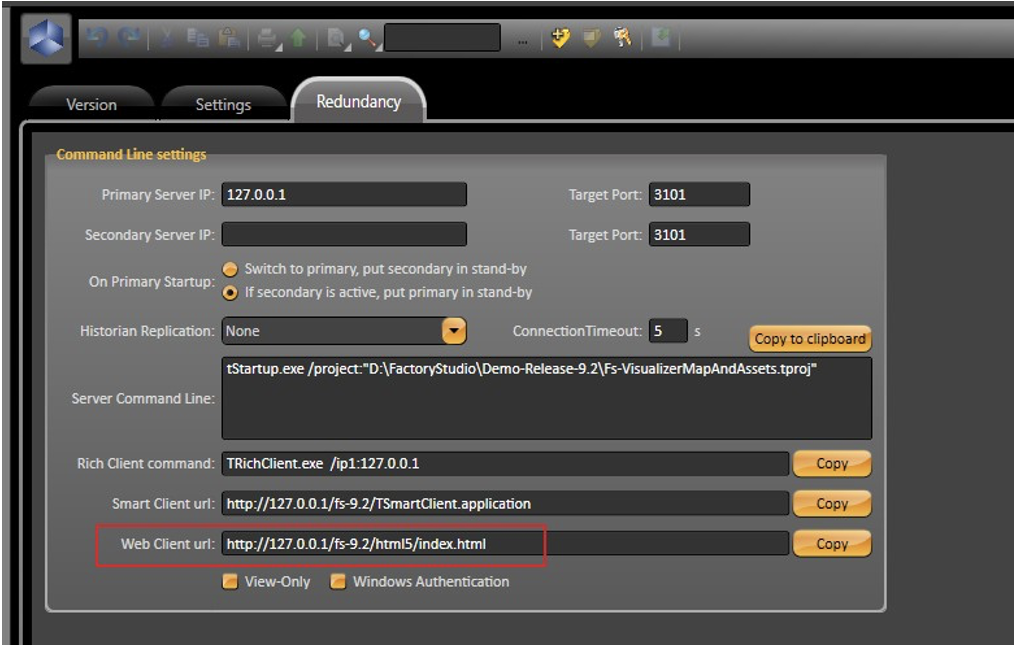
| Note |
|---|
When the WebServer is running on the default port 80 it is now required in the URL, as in the image above. |
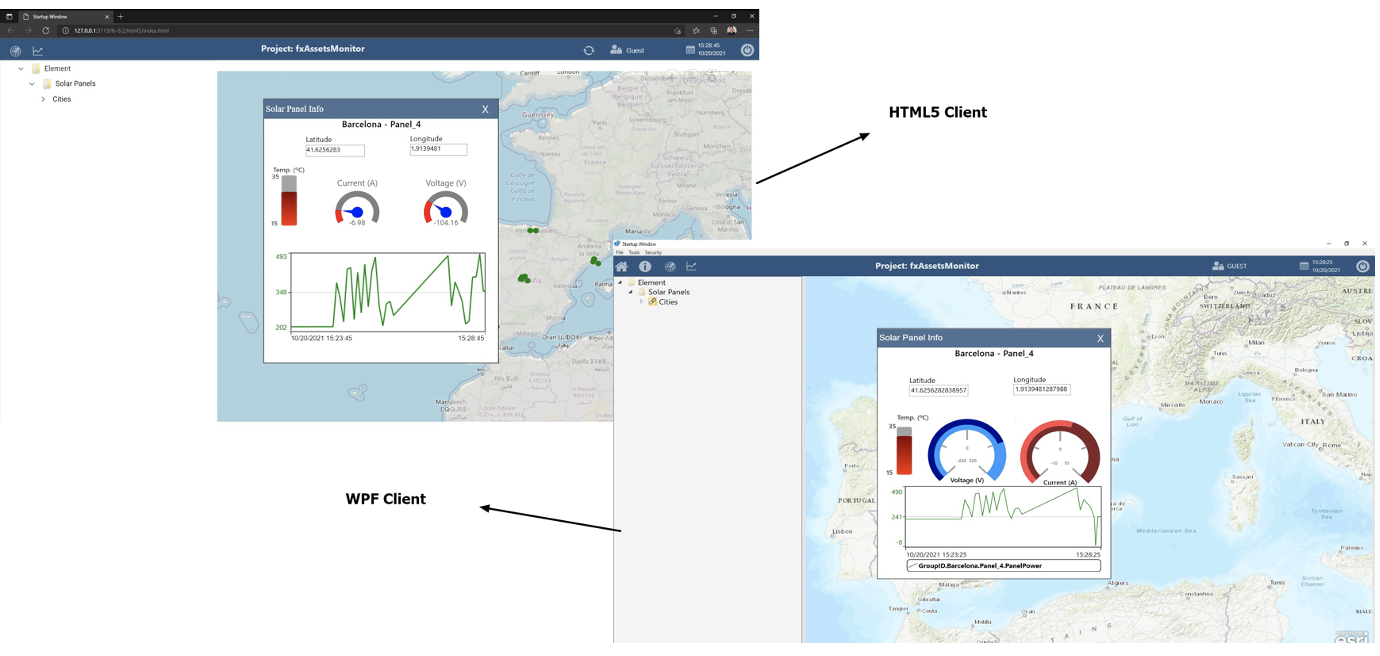
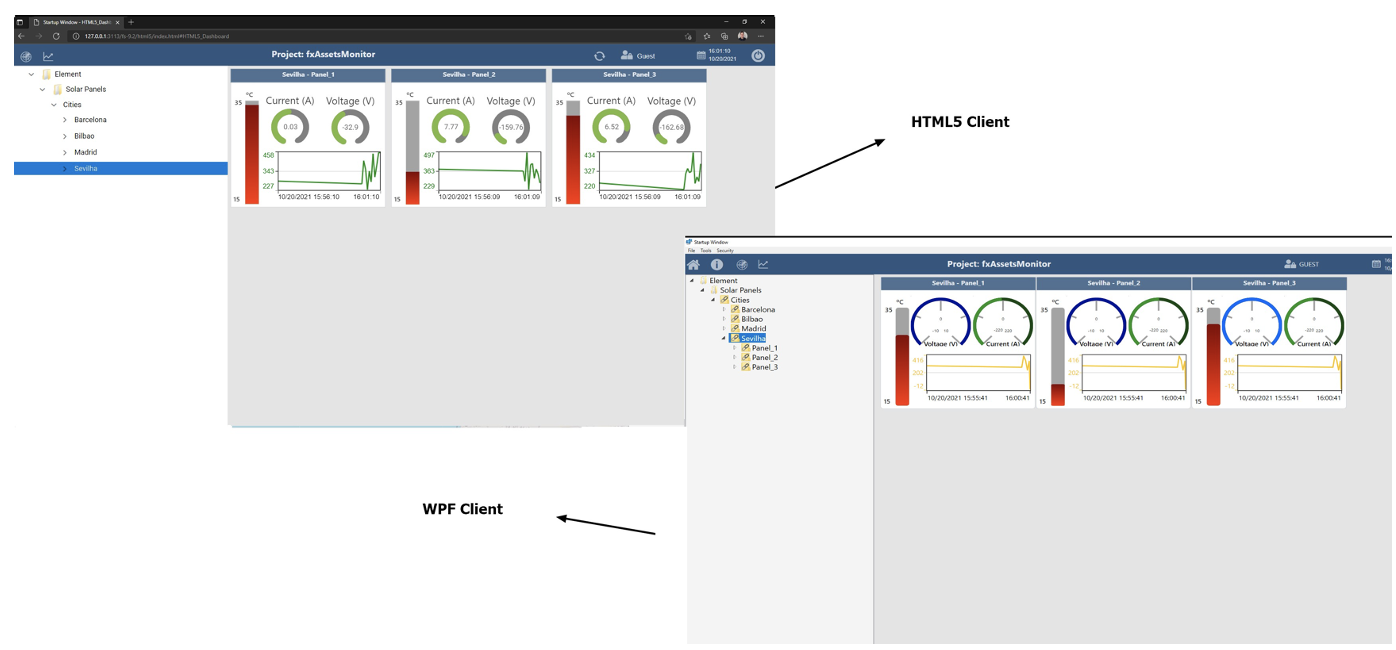
The visualization portion of this project is available both in WPF and HTML5 clients. Despite using different technologies (.Net Framework and Javascript), their behaviors and components are quite similar. Below you will find some images showing both clients.
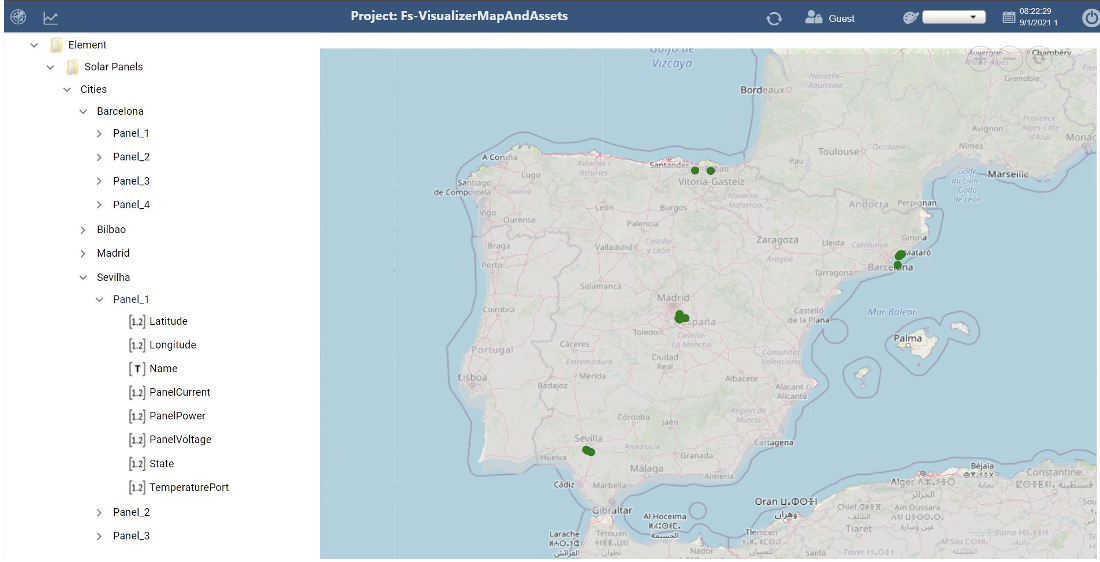
If your fxEdgeCollector configuration was done correctly and you have all necessary applications running, you should see some markers added to the Map components. They Once the client has started, you should see an AssetsControl component on the Left and a Map, with some markers, on the right. The markers are loaded from the CanaryHistorian Dataset (Latitude and Longitude coordinates defined in the MQTTspB SimulatorMQTTspBSimulator).
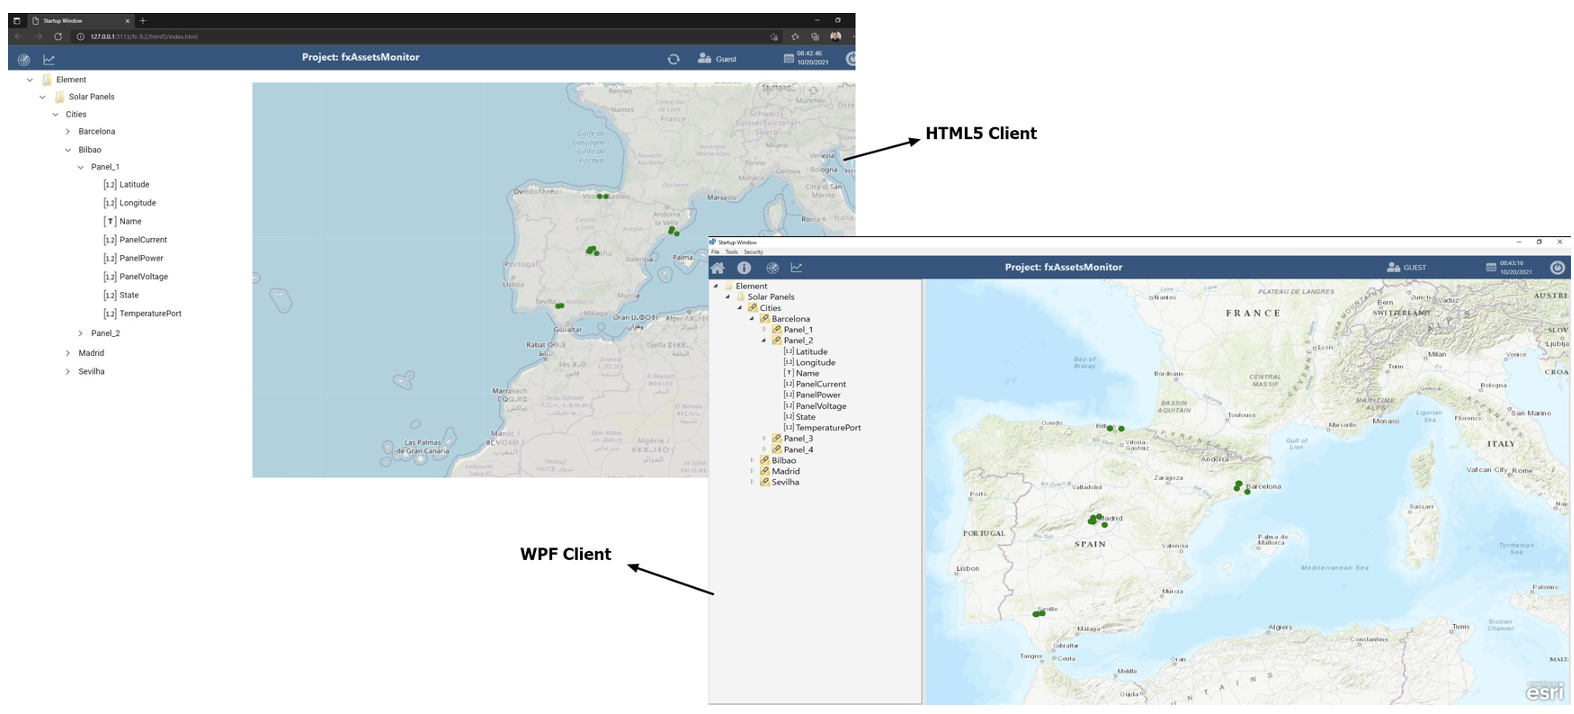
You can expand the AssetControl Expand the Asset Tree to see the inner elements and Click on the Marker to reveal some detailed information on that specific location.SolarPanel, as illustrated below.
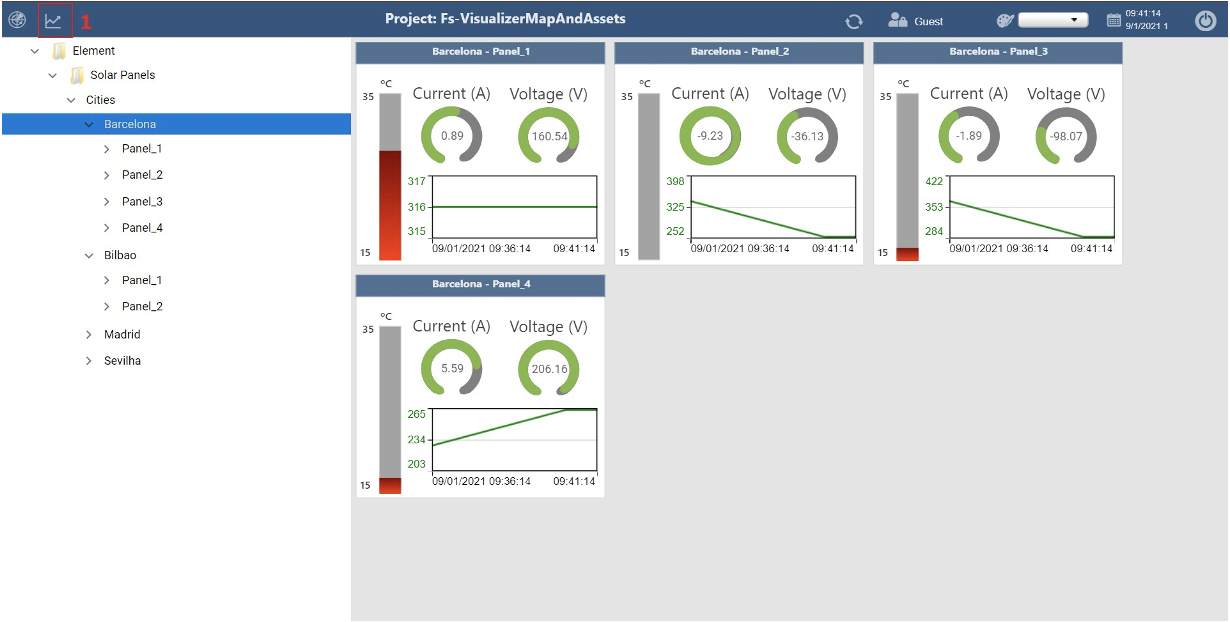
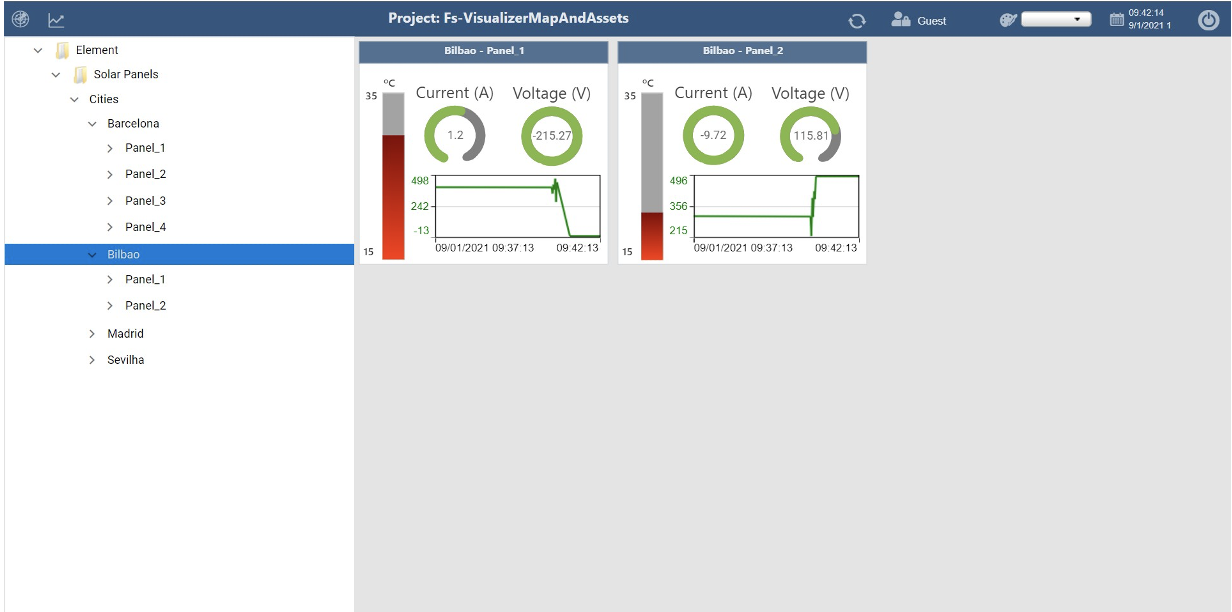
Navigating further down the AssetControl Tree under the Cities node, you will see the Cities that were created (Barcelona, Bilbao, Madrid and Sevilha, by default). Select one of the Cities Select a City from the AssetsControl and click on the Trend icon Icon (1) to open a Dynamic Window with containing information on all Panels that exists in that specific City.
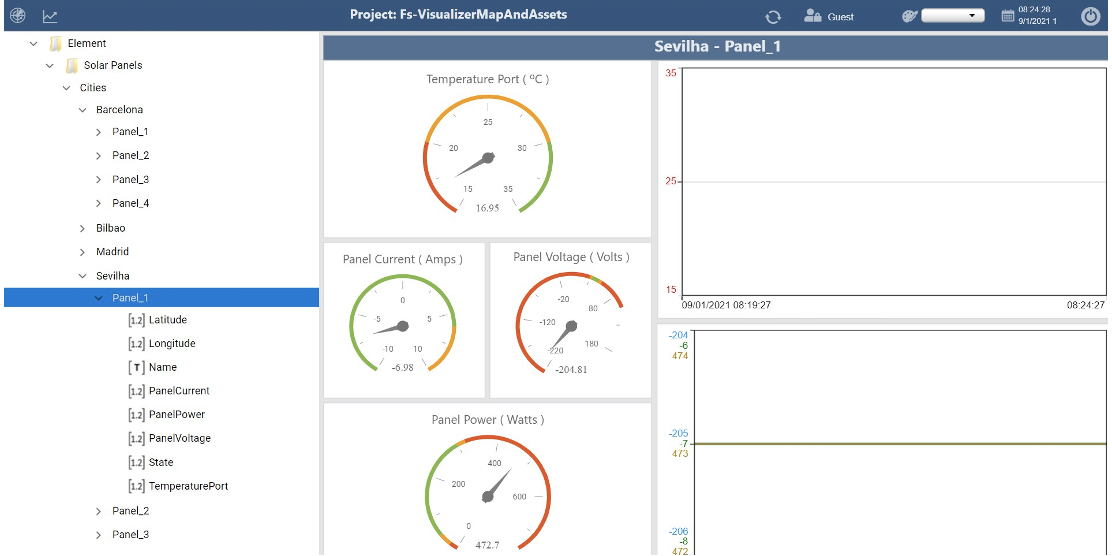
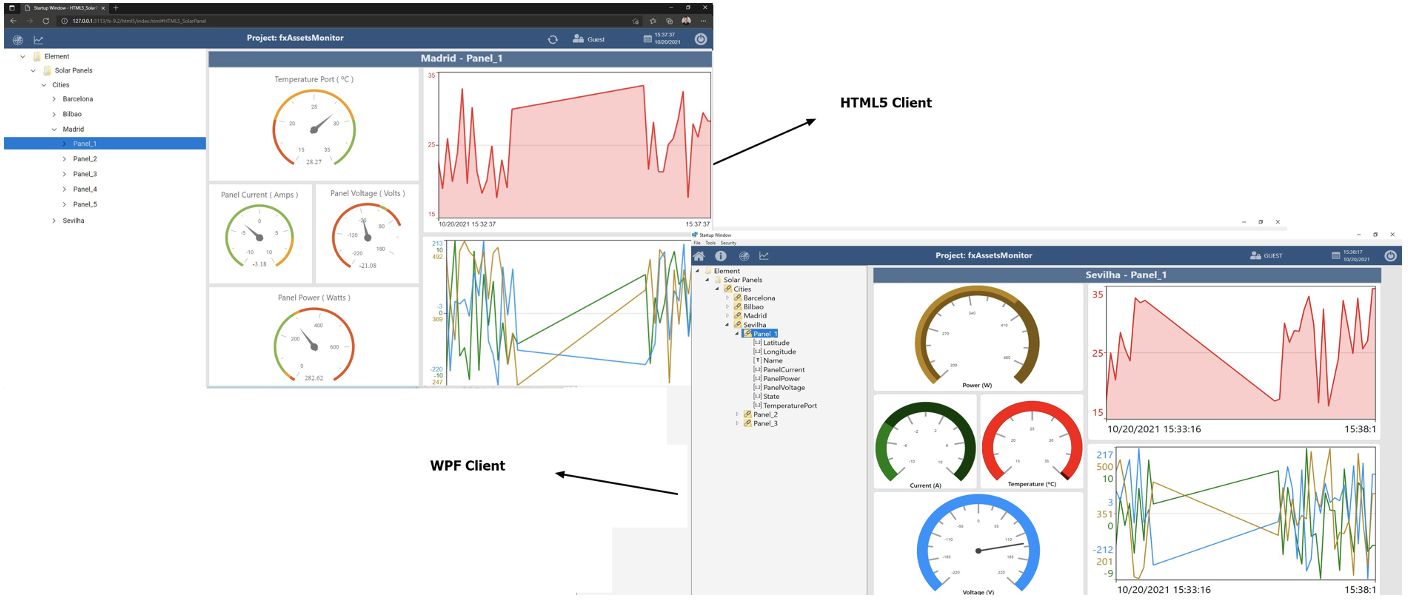
Lastly, select a Panel form the list to open a different Dashboard display with Gauges and Trend displaying the attributes values.
...
from that specific location.
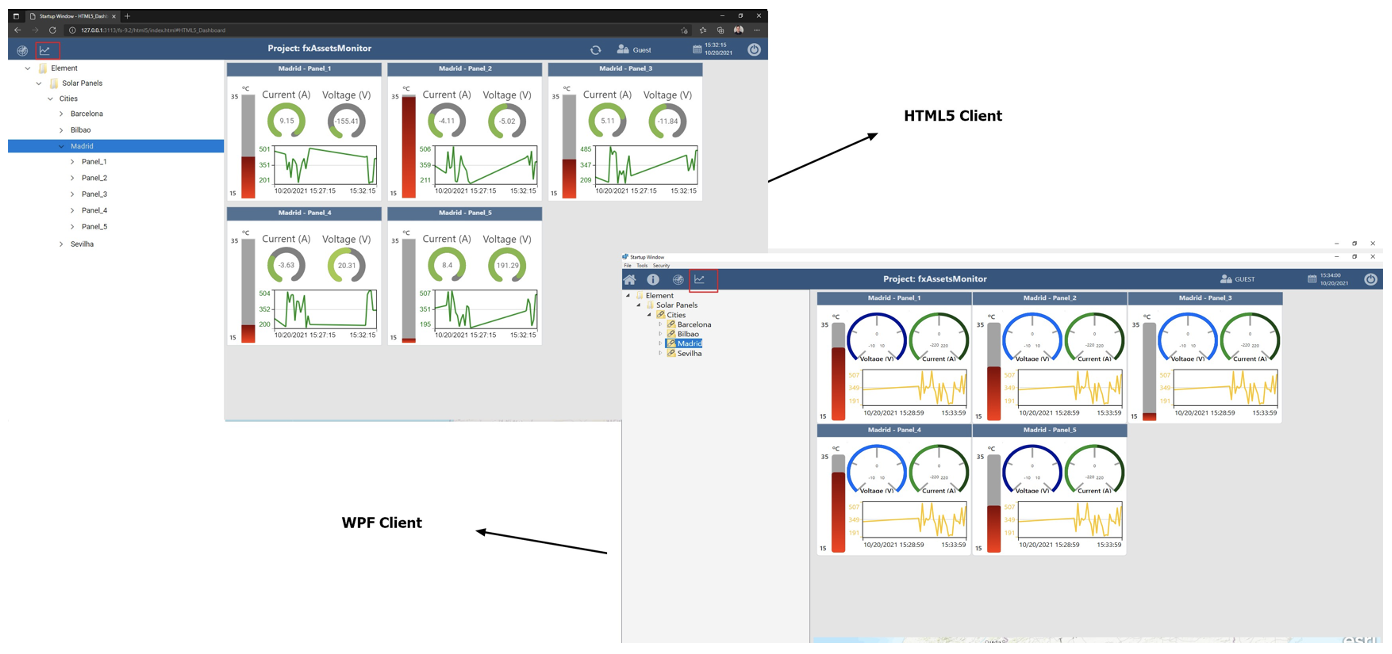
The image above is showing all 5 (five) panels from Madrid. The same Dynamic Display is automatically adjusted for a different quantity when Sevilha is selected, for example.
Going one level down, inside the Panels from a City, we can monitor the attribute values from that specific SolarPanel.
The TWebServer, our built-in WebServer application, not only is responsible for allowing Client connections through HTPP requests but also enabling your CanaryHistorian to forward Data into a different server.
When using this feature, if the connection to the Server you are pointing to is down, the application can store the data locally to be synchronized once the connection is established again.
At the fxEdgeCollector Project, under Edit → Tags → Providers, you will find a column named ServerIP. In this field you can enter an IP Address pointing to a server that contains a CanaryHistorian running. This Server must have a TWebServer running in order to be accessible.
In this demo, you can test this feature by entering the local loopback IP Address 127.0.0.1. You can force the application to store data to be synchronized by stopping the TWebServer at the Project Admin Display. The data should be forwarded once the TWebServer is running again.
On fxEdgeCollector project:
On fxAssetsMonitor project: