Summary
The Andon & Discrete Production Demo showcases some of the features you can use in building a real-time monitoring of a discrete Production system.
Download the Solution Example: Andon.dbsln
Download the Solution Database here: Andon.db
On this page:
Technical Information
Animated Production Overview
Key Performance Indicators (KPIs) are an important business tool for quickly gathering information to help speed up decision making.
With FactoryStudio you can include any calculations you need, when and where you need them.
Business metrics, OEE, JPM, Takt Time, Cycle Time, Days Worked Safe, MTTR, MTBF, even Predictive Maintenance numbers.
Show them with or without graphics, such as gauges, bar charts, trends, data grids, even enlarge them when you hover over them if you want!
Build your own library of calculations, or link to external systems for the data.
Have data from your in-house Python Machine Learning libraries – we can access that too!
We make it easy to get the data you want and display it when and where you want.
Interactive Controls
Build intuitive Interactive Controls to improve the efficiency and quality of your operations.
Reflect real-time conditions such as machine & product location, fault conditions, operator boxes, stack lights, and more.
Control your operations via touch on desktop, mobile, and browser.
Easily build industrial software solutions across many platforms, including Windows, Linux, iOS, and HTML5, all from the same Engineering Environment.

Include ERP Data for Scrap Cost
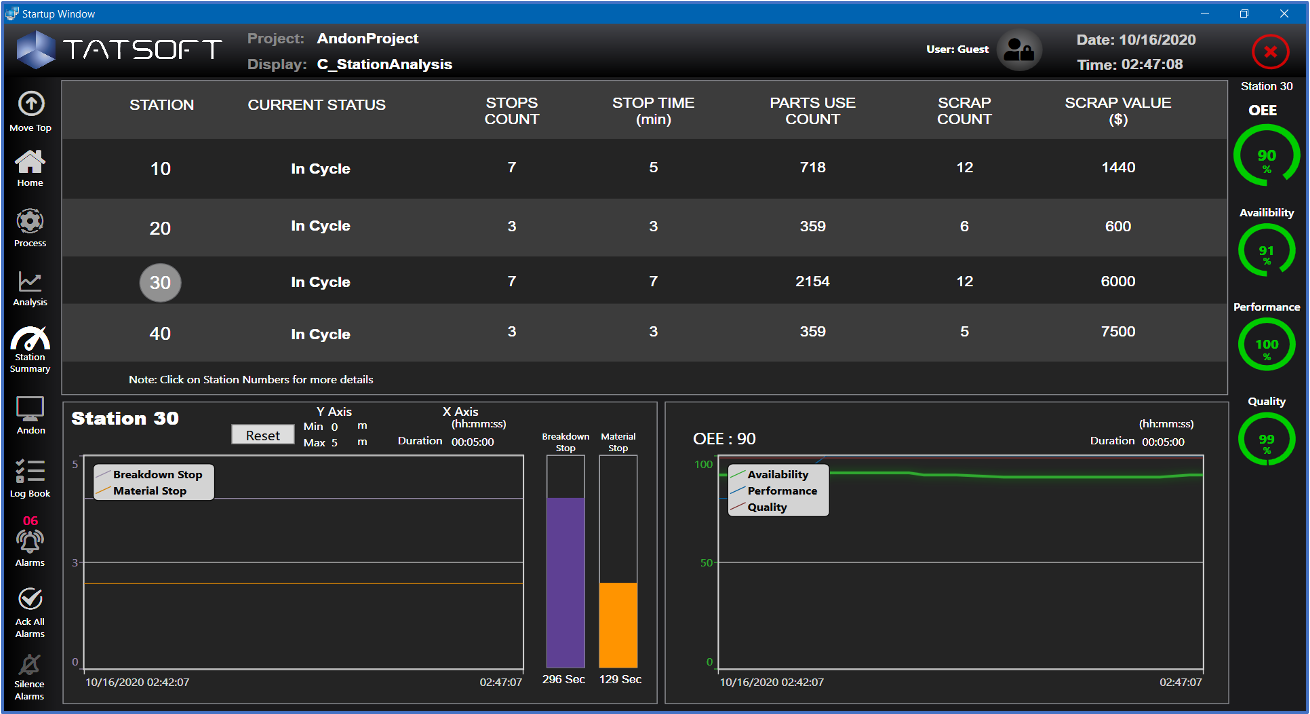
Easily integrate data from any system: e.g. ERP, WMS, CMMS, LIMS, CRM, database, historian, and PLCs.
Use our built-in visual SQL Query Builder to build and test your SQL Queries and verify data before adding it to your project.
Improve employee engagement by adding relevant extra-production data such as scrap cost or lost opportunity value (e.g. Downtime caused # of pallet losses during shift.)
Use ERP data with production data to help determine what maintenance should fix next based on cost, profit loss potential, etc.
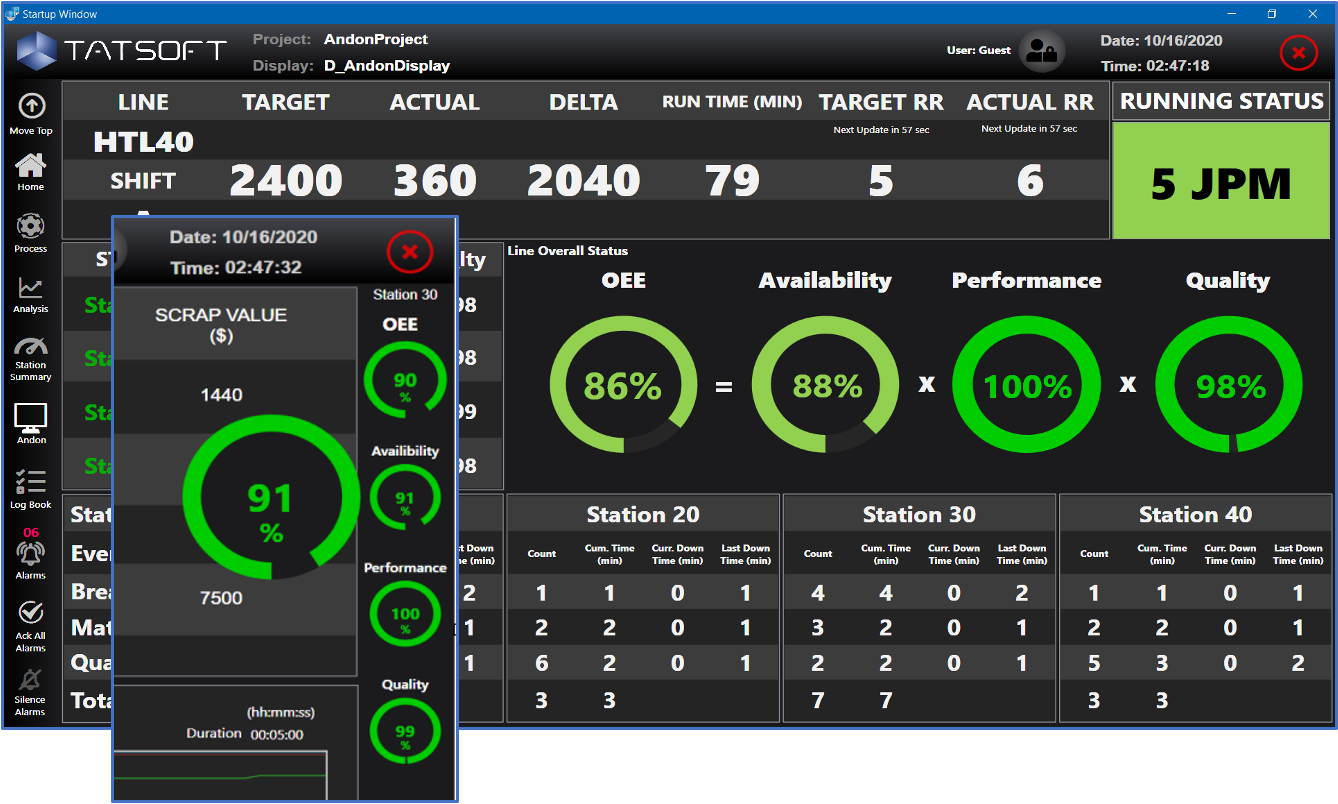
Andon & KPI Dashboards
With an Andon / KPI Dashboard, whether overhead, on your phone, or at your desk, get a quick glance at the stats you need anytime.
Easily define KPI gauge color bands to quickly show when things are running great…or not.
Keep the entire team on the same page with how things are going, at a glance.
Help foster friendly team competition by displaying multi-line stats in one overview.
Make it easy to spot who’s having a great run so you can congratulate them!

Efficient Alarm Management
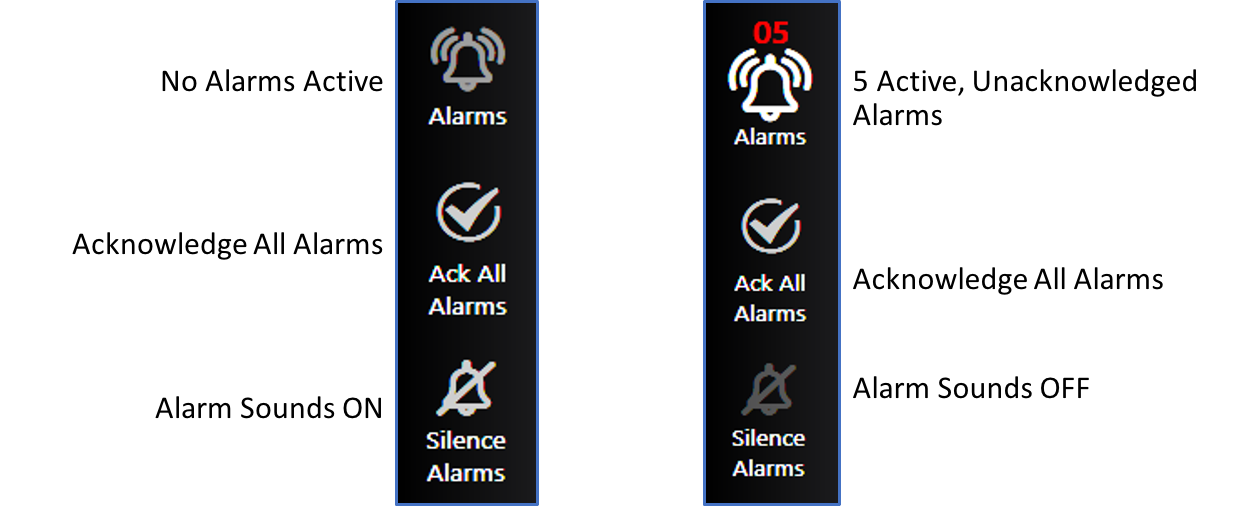
Make it easy to see, respond, and control alarm messages from any screen.
This project showcases 4 alarm management features all from the menu so you can manage things regardless of what other screen you may be using.
Visual symbols and colors help identify when there are alarms and shows you a count of how many unacknowledged alarms there are.
Easily silence alarms or even acknowledge them all at once.
And the color and size effects help you know when you’ve enabled the “silence alarms” feature.
Alarms & Alarm History
The built-in Alarm Management, Alarm History, and Alarm Acknowledgement makes alerting and recording your alarms super easy.
Quickly customize what you want to show.
Show alarms on screen, or in a report.
Trigger actions based on an alarm(s).
Maximize screen space with multiple Alarm panel types.
Several of our Pre-Built Project Templates have Alarm displays and footers already built for you. You're Welcome!
Easily Acknowledge and / or Silence alarms.
Historize Alarms, Acknowledgements, messages, check how long it took to acknowledge, and more.
Use our built-in database to use alarms right out-of-the-box. Or use it as a store-and-forward system to your own Historian. Or both!

Maintenance Logbook
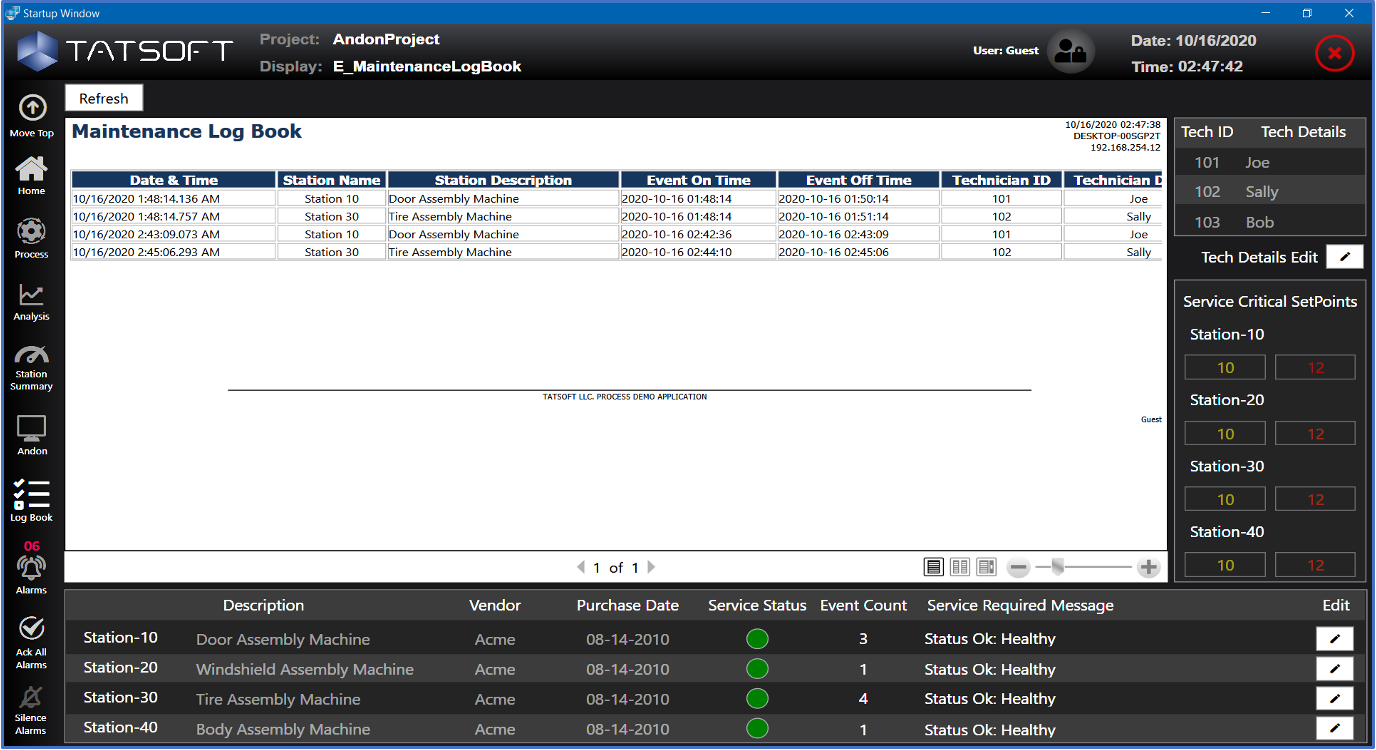
Reporting is built-in to help you with building things like a maintenance logbook, shift report, monthly overview, even regulatory reports.
Embed dynamically created charts and data tables.
Even color specific cells based on any criteria you want at the time the report is generated.
Use our built-in email component to send a report for any situation, automatically or at the push of a button.
Multiple Menu Options
Our Platform makes it quick and easy to use our pre-built menus, or to create your own!
Our “Industrial Icon” font – making adding an icon as easy as typing a single letter – complete with font size and color control!
Our Layout feature makes it easy to place a menu wherever it makes the most sense for your application – top, left, bottom, right – just a click away.
The Andon project features 2 menus as one possibility – starts on the left and has the option to move to the top as well!
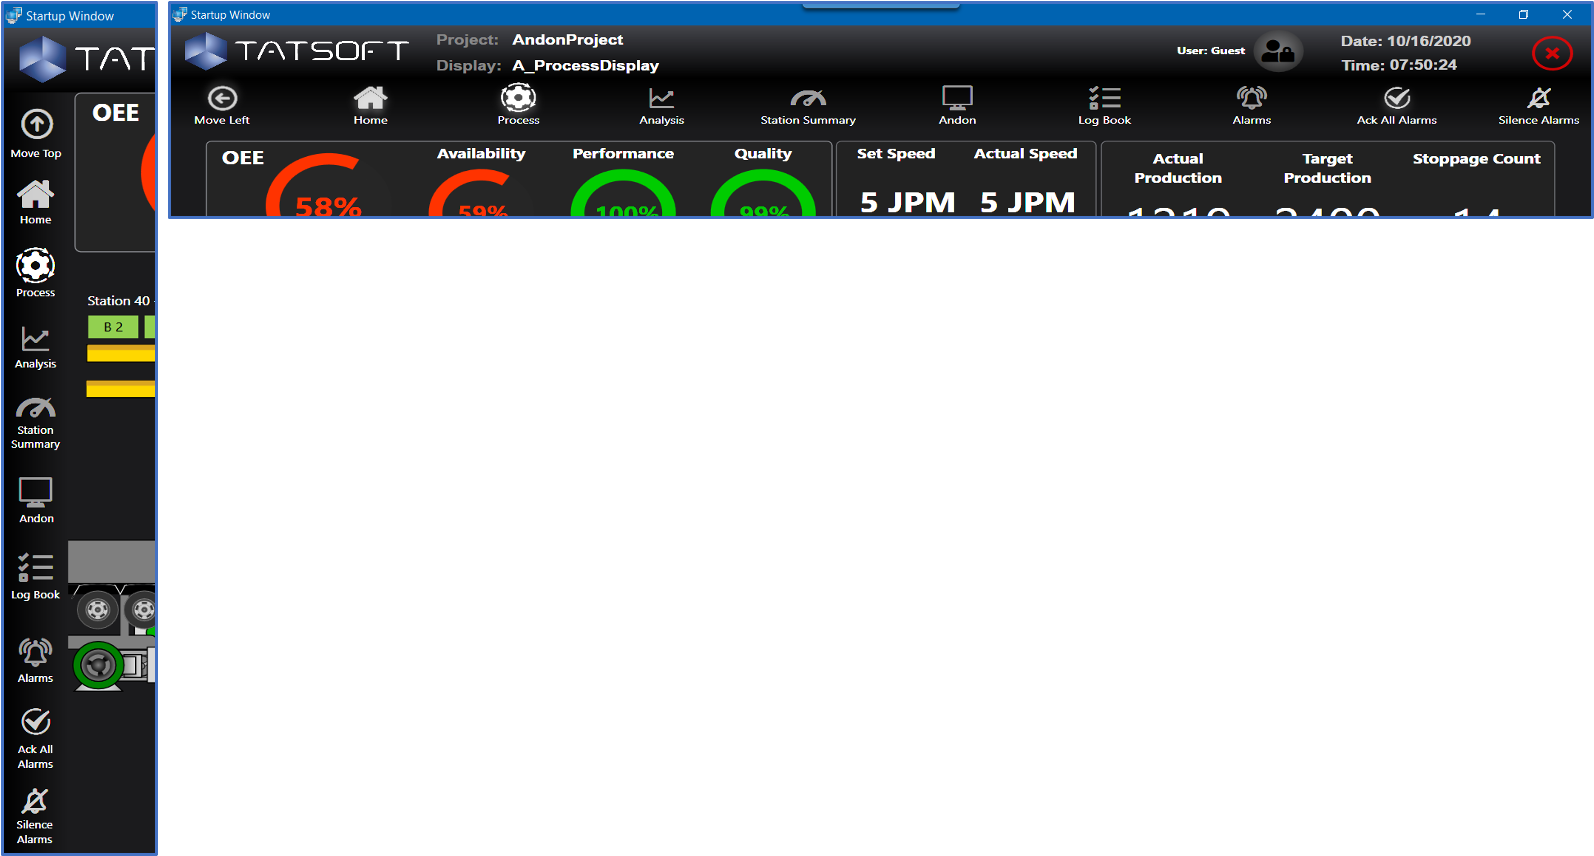
KPI, OEE, and Other Calculations
Key Performance Indicators (KPIs) are an important business tool for quickly gathering information to help speed up decision making.
With FrameworX you can include any calculations you need, when and where you need them.
Business metrics, OEE, JPM, Takt Time, Cycle Time, Days Worked Safe, MTTR, MTBF, even Predictive Maintenance numbers.
Show them with or without graphics, such as gauges, bar charts, trends, data grids, even enlarge them when you hover over them if you want!
Build your own library of calculations, or link to external systems for the data.
Have data from your in-house Python Machine Learning libraries – we can access that too!
We make it easy to get the data you want and display it when and where you want.
In this section: