Summary
The Solar Panel Demo showcases a distributed application example by simulating a solar panel solution's data collection, publishing, and viewing processes. This Demo uses a distributed software architecture to handle and process real-time data from multiple sources. It illustrates the practical application of technology in monitoring and managing renewable energy resources. This hands-on demonstration highlights how distributed applications can enhance efficiency and transparency in energy management systems.
There are 2 versions of SolarPanel demo.
The first version, 'SolarPanel.dbsln' included in the software distribution requires only one solution file, with the data is defined in tags in the solution itself and a simulated communication driver populating the values.
Download the solution file: SolarPanel.dbsln
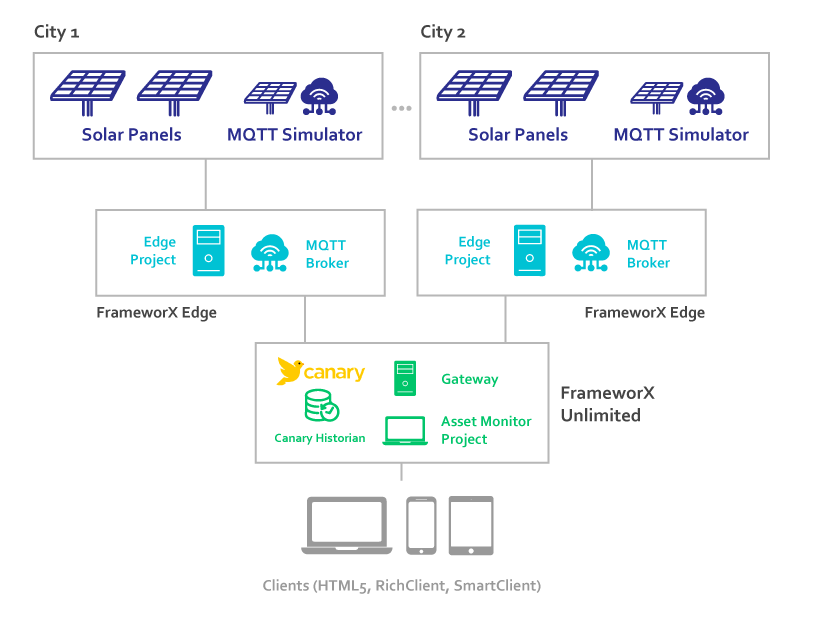
The other version, 'Distributed Application Demo', is composed the files 'fxMonitor.dbsln' and 'fxEdge.dbsnl', one one simulating the edge device publishing data and the other one with centralized monitoring of the entire system. This second version, requires Canary Historian. Download the solution files: SolarPanel.dbsln and SolarPanel.dbsln
This page will highlight the features of both versions.
On this page:
Solar Panel Demo
Asset Selection
The key display in that demo is the left panel, with the TAssetTree Control.

That control allows the operator to select that area he wants to monitor, and that information is saved on the built-in variable Client.Context. The key properties of the Client.Context are listed in the following table.
Client.Context Properties Updated by the TAssetTree UI control | |
|---|---|
Property | Description |
AssetName | The complete path for the asset. Example: \SolarPanels\Tripoli\Tripoli[1].PanelVoltage. |
AssetPath | Path of Parent Node (excluding final attribute) |
AssetNodeName | Name of parent folder. Example: Tripoli |
AssetNodeDepth | The Depth of the node in the treeL Example: 2 |
If you add Client.Context.AssetName to dynamic UI properties in the display, it will show that string value, like: "SolarPanels\Tripoli\Tripoli[1].PanelVoltage"
To show the VALUE of attribute use the syntax Asset(<string with asset name>). Example: Asset(Client.Context.AssetName)
For advanced applications instead of using the Client.Context.AssetName variable, you can create any expression that results the string with the AssetName you want to monitor.
The properties presented in this table are automatically populated when a TAssetTree in loaded in any display. In order to use that features, you must design your Operator UI having only AssetTree active at any given time.
Map Update with Geo Location

The display showing the map, uses the TMapsOSM control, available for both WPF and HTML5 pages.
When running only in Windows, it also available the TMapsESRI control and the TMapsGMap control.
The DisplayIsOpen() task monitors the Client.Context.AssetName and when ti changes, it uses the map control API to zoom to the coordinates of the selected city.
This demo was created settings the Displays to the option StretchFill, which will resize to use the entire client area, but will distort the image with you resize to other aspect radios.
You can also setup the system to various other OnResize options: StretchUniform, NoAction, Responsive, and ResizeChidren. For more information go to Display Settings page.
Detailed Information about the Asset
When one specific SolarPanel is selected a Process Screen shows the detailed information about that asset.
This diagram was created using a Smart Symbol (? see more about symbols).
In order to set the Symbol Parameters to bind the symbol the specific city, there are two ways to execute that setup.
Using the TFlowPanel Control or using the OnCreateDisplay Method.


Configuration of the Symbol Parameters
The TFlowPanel is an UI control that allows you setup multiple elements types to added dynamic to containers like WrapPanel, Grid, or StackPanels. it would be not the typical of that control, as it would be adding the dynamic to one object only, instead of multiple that is its main functionality. For more information see FlowPanel Control.
The second option, which is on Display opening methods, was used in the demo. The OnCreateDisplay(Canvas method) is called by the platform when the display is created, allowing you customize adding custom elements to the screen.
public void OnCreateDisplay(Canvas canvas)
{
	Dictionary<string, object> labels = new Dictionary<string, object>();
	string selectAsset = @Client.Context.AssetPath;
	labels["Name"] = selectAsset + "Name";
	labels["Current"] = selectAsset + "PanelCurrent";
	labels["Voltage"] = selectAsset + "PanelVoltage";
	labels["Power"] = selectAsset + "PanelPower";
	labels["Temperature"] = selectAsset + "";
	TSymbol.CreateSymbol("PanelSolarInfo", canvas, labels, 5, 5, false, false, false, false, null);
}
Multiple Assets Page

When a city is selected a dynamic page is creating show repetitions of the SolarPanelDashboard, each one mapping to a unit on the selected city.
Similarly to the detailed page, there are two ways to setup that in the configuration. Using the TFlowPanel control, previously described, or by the OnCreateDisplay internal method.
On with the OnCreateDisplay() methods, use the following code
public void OnCreateDisplay(Canvas canvas)
{
	double leftPosition = 5;
	double topPosition = 5;
	int len = TK.GetTagChildren(@Client.Context.AssetPath).Length;
	string assetPath = @Client.Context.AssetPath;
	for(int i = 0; i < len; i++) {
		Dictionary<string, object> labels = new Dictionary<string, object>();
		labels["Name"] = assetPath + "[" + i + "].Name";
		labels["Current"] = assetPath + "[" + i + "].PanelCurrent";
		labels["Voltage"] = assetPath + "[" + i + "].PanelVoltage";
		labels["Power"] = assetPath + "[" + i + "].PanelPower";
		labels["Temperature"] = assetPath + "[" + i + "].TemperaturePort";
		if((leftPosition + symbolWidth) >= display.Width) {
			topPosition = topPosition + symbolHeight;
			leftPosition = 5;
		}
		symbol = TSymbol.CreateSymbol("SimplePanel_WPF", canvas, labels, leftPosition, topPosition, false, false, false, false, null);
		leftPosition =  leftPosition + symbolWidth;
	}
Using Controls or Code
Using the built-in controls, like FlowPanel has the advantages of simplicity, or no knowledge of coding required. The option using the code has the advantage to you full control and advanced customization options.
Distributed Application Demo
In this section: