Page Tree
Previous Releases
...
A dashboard is a type of graphical user interface which provides an at-a-glance view of key performance indicators (KPIs) relevant to a particular objective.
Responsive dashboard displays have the ability to respond dynamically to any display size, which means the display will rearrange to format content based on the user’s display.
A data dashboard is the most efficient way to track multiple data sources because it provides a central location for businesses to monitor and analyze performance. The data is displayed in the form of tables, line charts, bar charts, and gauges.
Responsive dashboard displays have the ability to respond dynamically to any display size, which means the display will rearrange to format content based on the user’s display size and shape.
To create a Dashboard page, you need to navigate to the Draw Editor and click on the Create Display button.
...
The following elements are available in Dashboard Displays.displays:
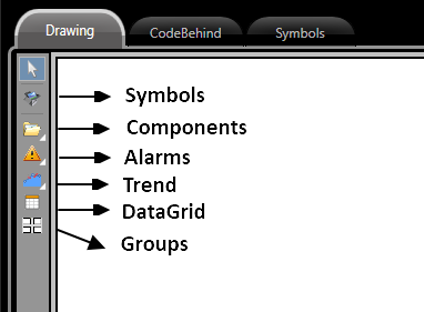
To use default graphic elements (such as buttons, textboxes, checkboxes, etc), a custom-made symbol with the desired elements is required.
...