Page Tree
Previous Releases
...
A data dashboard is the most efficient way to track multiple data sources because it provides a central location for businesses to monitor and analyze performance. The data is displayed in the form of tables, line charts, bar charts, and gauges.
To create a Dashboard page you need to navigate to the Draw Editor and click at on the Create Display button.
...
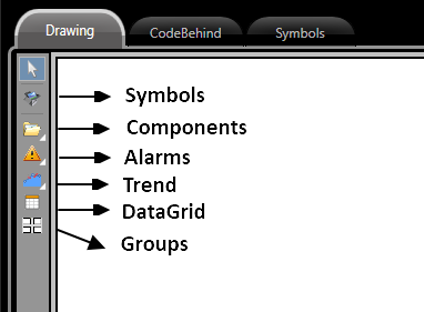
Elements in Dashboard displays.
|
...