Page Tree
Previous Releases
...
...
In this section, we will describe how to configure each program.
Visual Studio Code is an open-source, streamlined code editor with support for development operations like debugging, task running, and version control. Visual Studio Code can be downloaded here.
To download the extension that allows interactions of to Visual Studio, Azure IoT Hub, and IoT Device Management, click here.
...
After installing the extension, open the VSCode application. In the explorer pane of the VS Code, click the ”Azure IoT Hub” tab in the bottom left corner (1 below), and click ”Select IoT Hub” (2) in the context menu.
...
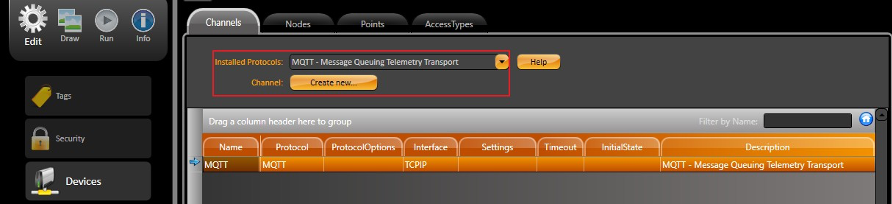
In your project’s Engineering environment, navigate to Devices>Channels Devices > Channels and add a new MQTT channel by selecting it from the Installed Protocols menu.
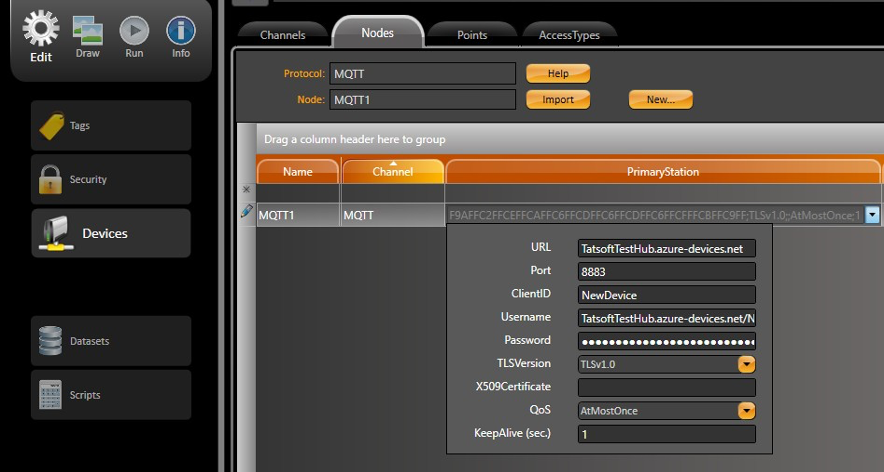
In Devices>Nodes Devices > Nodes, add a node for the newly created MQTT Channel. The primary station's configuration is made as follows:
| Code Block |
|---|
URL = <Host Name> Port = <Port Number> Client ID = <Device Id> Username = <Host Name>/<Device Id> Password = <SAS Token> TLS Version = <TLSv1.0> X059 Certificate = <Certificate thumbprint> (optional) QoS = <Quality of Service> Keep Alive = <Message sent to Broker to prevent the link from being broken> (in seconds) |
For the IoT Hub and the device configured in VSCode, the parameters are as follows.
| Code Block |
|---|
URL = TatsoftTestHub.azure-devices.net Port = 8883 Client ID = NewDevice Username = TatsoftTestHub.azure-devices.net/NewDevice Password = SharedAccessSignature sr=TatsoftTestHub.azure-devices.net&sig=pzzXCZK%2 BQ6dJUe2Hf1SptTR1oPMbfyip0K9M4TQPZc4%3D&skn=iothubowner&se=1593008673 TLS Version = <TLSv1.0> X059 Certificate = QoS = AtMostOnce Keep Alive = 1 |
Finally, in Devices> Devices > Points, you fill fill in the address information according to the syntax below:
...
Once the device configuration is complete, go to Run>Startup Run > Startup and execute the project. Enable the Debug and Devices options by clicking on settings and selecting the corresponding boxes. Open the TraceWindow and monitor the communication exchange.
...